. 2012 May 16:13:99.
doi: 10.1186/1471-2105-13-99.

MetaMapp: mapping and visualizing metabolomic data by integrating information from biochemical pathways and chemical and mass spectral similarity

Affiliations

MetaMapp: mapping and visualizing metabolomic data by integrating information from biochemical pathways and chemical and mass spectral similarity

Dinesh K Barupal et al. BMC Bioinformatics. .

Abstract

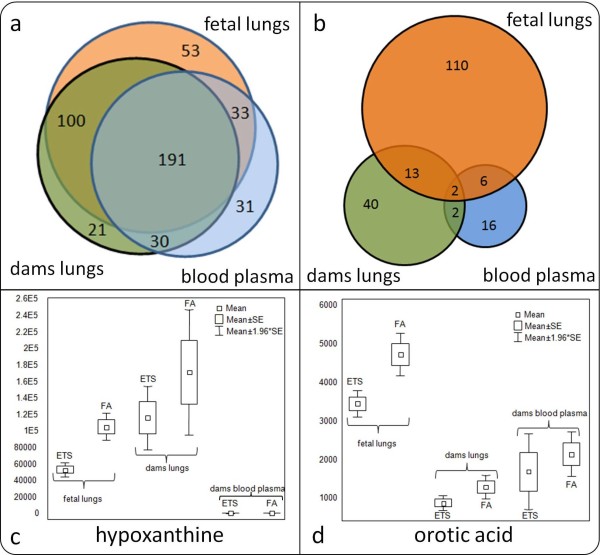
Background: Exposure to environmental tobacco smoke (ETS) leads to higher rates of pulmonary diseases and infections in children. To study the biochemical changes that may precede lung diseases, metabolomic effects on fetal and maternal lungs and plasma from rats exposed to ETS were compared to filtered air control animals. Genome- reconstructed metabolic pathways may be used to map and interpret dysregulation in metabolic networks. However, mass spectrometry-based non-targeted metabolomics datasets often comprise many metabolites for which links to enzymatic reactions have not yet been reported. Hence, network visualizations that rely on current biochemical databases are incomplete and also fail to visualize novel, structurally unidentified metabolites.

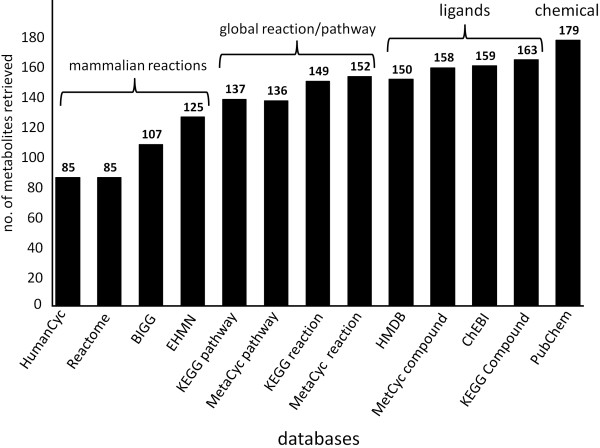
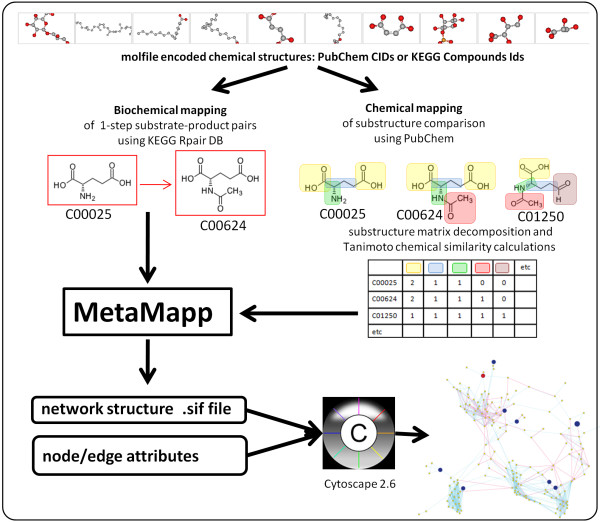
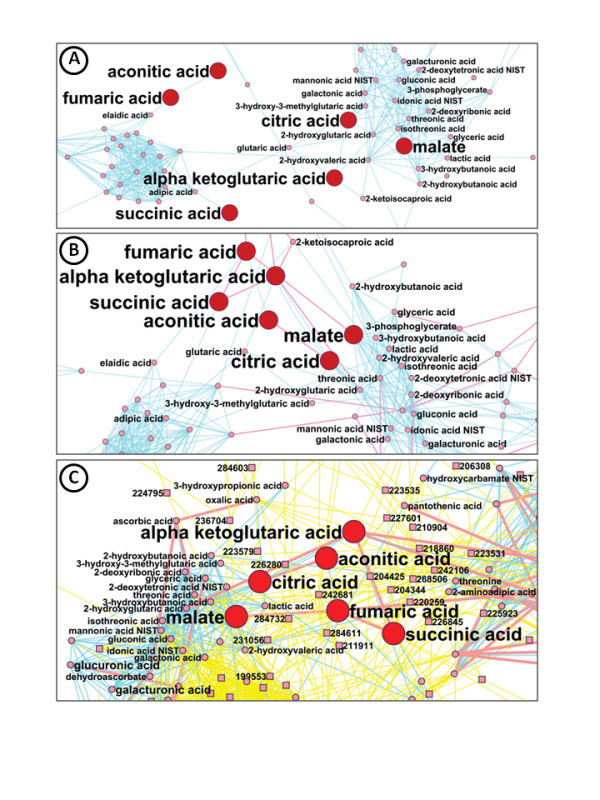
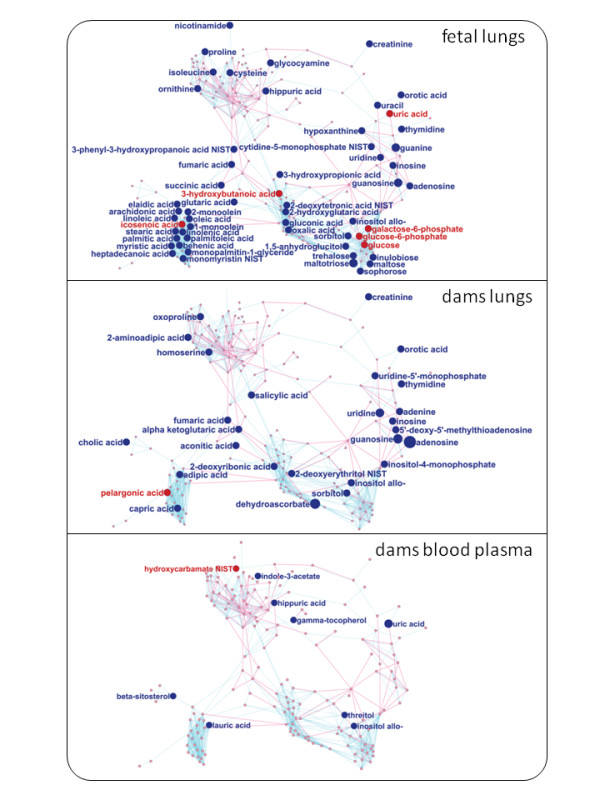
Results: We present a novel approach to integrate biochemical pathway and chemical relationships to map all detected metabolites in network graphs (MetaMapp) using KEGG reactant pair database, Tanimoto chemical and NIST mass spectral similarity scores. In fetal and maternal lungs, and in maternal blood plasma from pregnant rats exposed to environmental tobacco smoke (ETS), 459 unique metabolites comprising 179 structurally identified compounds were detected by gas chromatography time of flight mass spectrometry (GC-TOF MS) and BinBase data processing. MetaMapp graphs in Cytoscape showed much clearer metabolic modularity and complete content visualization compared to conventional biochemical mapping approaches. Cytoscape visualization of differential statistics results using these graphs showed that overall, fetal lung metabolism was more impaired than lungs and blood metabolism in dams. Fetuses from ETS-exposed dams expressed lower lipid and nucleotide levels and higher amounts of energy metabolism intermediates than control animals, indicating lower biosynthetic rates of metabolites for cell division, structural proteins and lipids that are critical for in lung development.

Conclusions: MetaMapp graphs efficiently visualizes mass spectrometry based metabolomics datasets as network graphs in Cytoscape, and highlights metabolic alterations that can be associated with higher rate of pulmonary diseases and infections in children prenatally exposed to ETS. The MetaMapp scripts can be accessed at http://metamapp.fiehnlab.ucdavis.edu.


Figures

Figure 1
Figure 1
Overview analysis of metabolomic data and differential metabolic regulation for fetal lungs, and maternal blood plasma and maternal lungs of rats exposed to environmental tobacco smoke (ETS) compared to filtered-air (FA) exposed animals. (A) High confidence detection (BinBase) and overlap of metabolites among all three tested organs. (B) Number of differentially altered metabolites (p < 0.05), and overlap of significant differences among three organs. (C&D). Exemplary box and whisker plots of two metabolites that were found significantly altered in three organs.
Figure 2
Figure 2
Data representation of a total of 179 identified metabolites from the rat environmental tobacco smoke metabolomics study by querying various bioinformatics databases. Databases were queried using KEGG and PubChem identifiers in addition to individual compound names.
Figure 3
Figure 3
Schema of network integration and visualization using MetaMapp and Cytoscape. For biochemical mapping, the KEGG reactant pairs database was used. Chemical similarity mapping was performed using 881- substructure fingerprints within the PubChem database. MetaMapp tools then integrated biochemical and chemical similarity matrix files to visualize the network in Cytoscape. Attribute files such as fold-changes and statistical thresholds were added to inform about metabolic regulation in case/control studies.
Figure 4
Figure 4
MetaMapp zoom-ins for results of mapping metabolomic data using three different approaches, focusing on the biochemically strongly related TCA cycle metabolites as example (highlighted with bold labels and red nodes). Identified metabolites are represented by circle nodes; unknown metabolites by square nodes. Red edges denote KEGG reactant pair links; blue edges symbolize Tanimoto chemical similarity at T > 700; yellow edges give mass spectral similarity > 700. Cytoscape session files are given as additional information S8, including metabolite names that have been left out of the network graphs for visual clarity. (A) Mapping 179 identified metabolites solely using Tanimoto chemical similarity as input data. (B) Integration of KEGG reactant pair information with the Tanimoto chemical similarity matrix (threshold T > 700). (C) Integration of KEGG reactant pair information with the Tanimoto chemical similarity matrix of all 179 identified metabolites and the mass spectral similarity matrix of all 459 compounds, including unknowns (squared nodes, exemplified with BinBase database identifier numbers).
Figure 5
Figure 5
MetaMapp visualization of metabolomic data highlighting the differential metabolic regulation in fetal lungs, maternal blood plasma and maternal lungs of rats exposed to environmental tobacco smoke compared to filtered-air exposed animals. Red edges denote KEGG reactant pair links; blue edges symbolize Tanimoto chemical similarity at T > 700; unknowns are left out of these graphs for visual clarity. Metabolites found significantly up- regulated under exposure to environmental tobacco smoke (p < 0.05) are given as red nodes and labeled by BinBase names; blue nodes give down-regulated metabolites. Node sizes reflect fold change. Metabolites that were not found to be differentially regulated were left unlabeled for visual clarity. Red edges denote KEGG reactant pair links; blue edges symbolize Tanimoto chemical similarity at T > 700.

References

    1. Mukhopadhyay P, Horn KH, Greene RM, Michele Pisano M. Prenatal exposure to environmental tobacco smoke alters gene expression in the developing murine hippocampus. Reprod Toxicol. 2010;29:164–175. doi: 10.1016/j.reprotox.2009.12.001. - DOI - PMC - PubMed
    1. Gilmour MI, Jaakkola MS, London SJ, Nel AE, Rogers CA. How exposure to environmental tobacco smoke, outdoor air pollutants, and increased pollen burdens influences the incidence of asthma. Environ Health Perspect. 2006;114:627–633. doi: 10.1289/ehp.8380. - DOI - PMC - PubMed
    1. Gilliland FD, Berhane K, McConnell R, Gauderman WJ, Vora H, Rappaport EB, Avol E, Peters JM. Maternal smoking during pregnancy, environmental tobacco smoke exposure and childhood lung function. Thorax. 2000;55:271–276. doi: 10.1136/thorax.55.4.271. - DOI - PMC - PubMed
    1. Zhong CY, Zhou YM, Joad JP, Pinkerton KE. Environmental tobacco smoke suppresses nuclear factor-kappaB signaling to increase apoptosis in infant monkey lungs. Am J Respir Crit Care Med. 2006;174:428–436. doi: 10.1164/rccm.200503-509OC. - DOI - PMC - PubMed
    1. Gairola CG, Wu H, Gupta RC, Diana JN. Mainstream and sidestream cigarette smoke-induced DNA adducts in C7Bl and DBA mice. Environ Health Perspect. 1993;99:253–255. - PMC - PubMed

Publication types

Substances