

Review
doi: 10.1161/CIRCIMAGING.112.973727.
Molecular imaging of aortic aneurysms
Affiliations
- PMID: 22592009
- PMCID: PMC3386267
- DOI: 10.1161/CIRCIMAGING.112.973727
Item in Clipboard
Review
Molecular imaging of aortic aneurysms
Circ Cardiovasc Imaging.
.
No abstract available
Figures
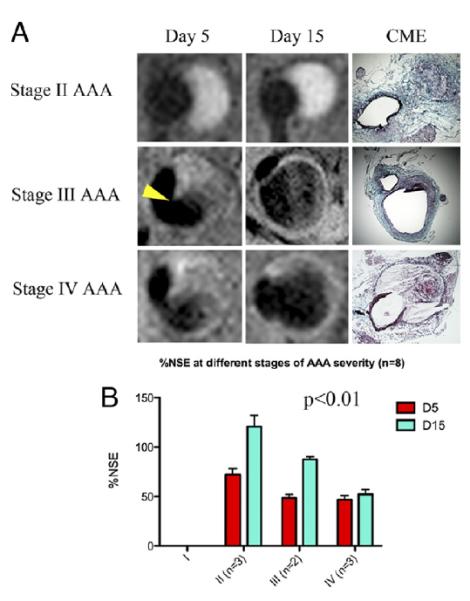
A: Typical images of stage II, III, and IV abdominal aortic aneurysms (AAAs) obtained after CNA-35 injection at day 5 and day 15 of AAA development. Corresponding histological sections stained with combined Masson elastin are shown in the third column. B: Quantification of aneurysm severity (increasing from stage I to IV) and normalized signal enhancement percentage (%NSE) relative to CNA-35 injection. From Klink et al with permission from Elsevier.
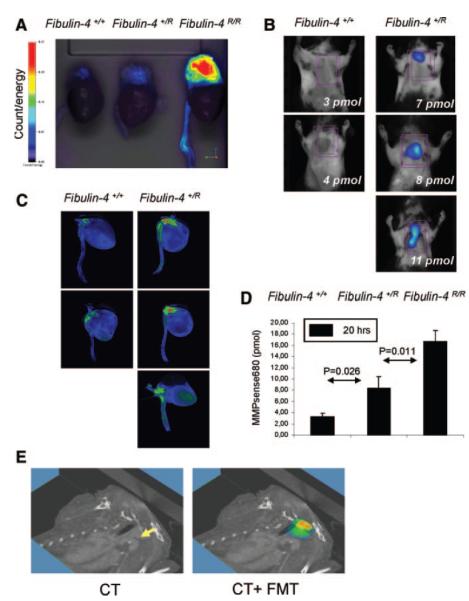
Graded increase in MMPs within the aneurysmal lesions in fibulin-4+/R and fibulin-4R/R mice ex vivo. B, Quantification of FMT-derived fluorescence of excited fluorochrome in the aorta. C, Ex vivo analysis of the MMP increase within the aortic arch area in fibulin-4+/+ and fibulin-4+/R mice. D, Isosurface concentration mapping from reconstructed tomographic images showing a graded increase in activation of signal within the aortic arch area of fibulin-4+/R and fibulin-4R/R mice compared to wild-type fibulin-4+/+ animals E, Three-dimensional FMT-CT co-registration of the heart and aorta of a heterozygous fibulin-4+/R mouse. From Kaijzel et al with permission from Wolters Kluwer Health
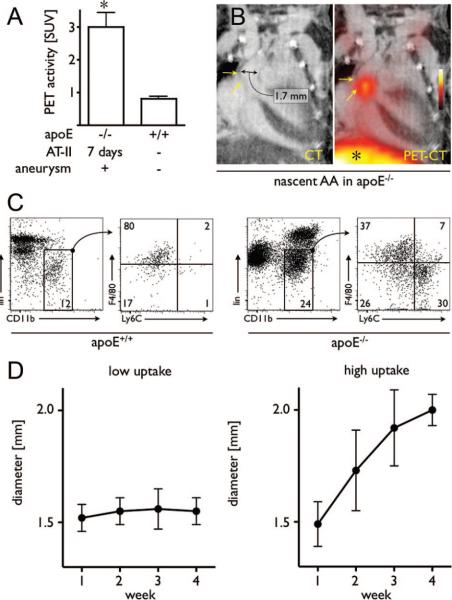
Imaging in mice with early-stage aneurysms undergoing 7 days of Ang-II administration. A, PET signals from aneurysms and from wild-type mice. B, Representative PET-CT images of a nascent AA. * indicates liver signal. C, Flow cytometric analysis of leukocytes in the aorta of wild-type mice (left 2 plots) and apoE−/− mice (right 2 plots) after 7 days of Ang-II administration. The gated regions in the left plots for each mouse type depict the monocyte/macrophage population, which were further analyzed for expression of the monocyte surface marker Ly6-C and the macrophage marker F4/80 (plots on the right). Lin indicates lineage antigens (CD90/B220/CD49b/NK1.1/Ly-6G). Numbers contained within the gated regions of the plots (left plots) indicate the percentage of living cells (macrophages/monocytes). Numbers in the quadrants (right plots) indicate the percentage of monocytes/macrophages in each gate. D, Serial CT angiography after PET-CT on day 7 in Ang-II treated apoE−/− mice. Left panel shows the diameter of aneurysms with low PET signal; right panel shows diameter of aneurysms with high signal. From Nahrendorf et al with permission from Wolters Kluwer Health
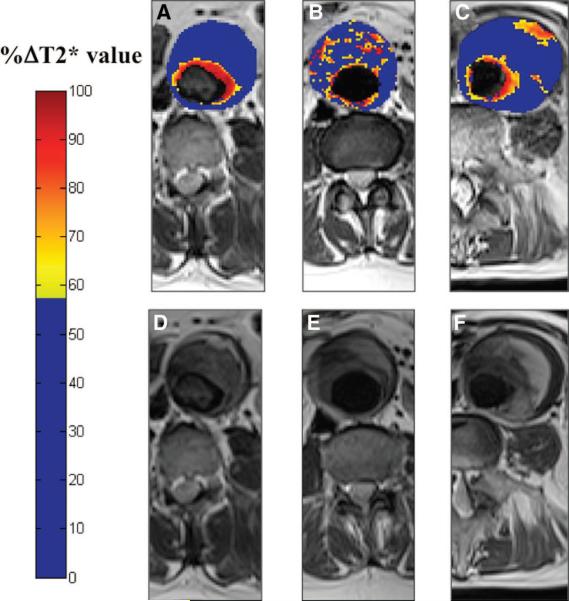
Top: Color maps (A through C) showing representative abdominal aortic aneurysm (AAA) slices from patients in each of the 3 groups alongside the corresponding T2W anatomic images (D through F). The color scale represents the magnitude of the change in T2* value, with blue indicating minimal change and red indicating a large change in T2* value. A distinctive pattern is seen for each patient group: A, Group 1 shows a large change in T2* value only in the periluminal area; B, Group 2, diffuse patchy changes in T2* throughout the intraluminal thrombus but no distinct focal area of USPIO uptake affecting the aortic wall; and C, Group 3, discrete focal area of USPIO uptake involving the wall of the AAA that is distinct from the periluminal region. This patient subsequently died suddenly from presumed ruptured AAA. Bottom: Relationship of diameter and growth rate with patient group. Initial aneurysm diameters (open bars) are similar for the 3 groups, but the aneurysm growth rates (solid bars) are higher for patients in group 3 (0.66 cm/y) compared with those in groups 1 (0.22cm/y) and 2 (0.24 cm/y). From Richards et al with permission from Wolters Kluwer Health.
Similar articles
-
Emergence of molecular imaging of aortic aneurysm: implications for risk stratification and management.J Nucl Cardiol. 2014 Apr;21(2):251-67; quiz 268-70. doi: 10.1007/s12350-013-9845-5. Epub 2014 Jan 1. J Nucl Cardiol. 2014. PMID: 24381115 Free PMC article. Review.
-
Functional and molecular imaging techniques in aortic aneurysm disease.Curr Opin Cardiol. 2013 Nov;28(6):609-18. doi: 10.1097/HCO.0b013e3283644beb. Curr Opin Cardiol. 2013. PMID: 24030165 Review.
-
Multi-modality molecular imaging of aortic aneurysms.J Nucl Cardiol. 2017 Aug;24(4):1239-1245. doi: 10.1007/s12350-017-0883-2. Epub 2017 Apr 26. J Nucl Cardiol. 2017. PMID: 28447279 Free PMC article. Review.
-
Inflammatory aortic aneurysms: characteristic appearance on magnetic resonance imaging.Eur J Vasc Surg. 1992 Jul;6(4):399-402. doi: 10.1016/s0950-821x(05)80287-7. Eur J Vasc Surg. 1992. PMID: 1499743
-
Magnetic resonance imaging of thoracic aortic aneurysms: comparison with other imaging methods.AJR Am J Roentgenol. 1986 Feb;146(2):309-14. doi: 10.2214/ajr.146.2.309. AJR Am J Roentgenol. 1986. PMID: 3510513
Cited by
-
Morphological and Biomechanical Differences in the Elastase and AngII apoE(-/-) Rodent Models of Abdominal Aortic Aneurysms.Biomed Res Int. 2015;2015:413189. doi: 10.1155/2015/413189. Epub 2015 May 3. Biomed Res Int. 2015. PMID: 26064906 Free PMC article.
-
Molecular imaging of atherosclerosis: clinical state-of-the-art.Heart. 2014 Sep 15;100(18):1469-77. doi: 10.1136/heartjnl-2011-301370. Epub 2013 Dec 23. Heart. 2014. PMID: 24365664 Free PMC article.
-
Multimodal iron oxide nanoparticles for hybrid biomedical imaging.NMR Biomed. 2013 Jul;26(7):756-65. doi: 10.1002/nbm.2872. Epub 2012 Oct 15. NMR Biomed. 2013. PMID: 23065771 Free PMC article. Review.
-
Ascending thoracic aortic aneurysms protect against myocardial infarctions.Int J Angiol. 2014 Sep;23(3):177-82. doi: 10.1055/s-0034-1382288. Int J Angiol. 2014. PMID: 25317029 Free PMC article.
-
Imaging macrophages with nanoparticles.Nat Mater. 2014 Feb;13(2):125-38. doi: 10.1038/nmat3780. Nat Mater. 2014. PMID: 24452356 Review.
References
-
- Johnston KW, Rutherford RB, Tilson MD, Shah DM, Hollier L, Stanley JC. Suggested standards for reporting on arterial aneurysms. Subcommittee on reporting standards for arterial aneurysms, ad hoc committee on reporting standards, Society for Vascular Surgery and North American Chapter, International Society for Cardiovascular Surgery. J Vasc Surg. 1991;13:452–458. - PubMed
-
- Guo DC, Papke CL, He R, Milewicz DM. Pathogenesis of thoracic and abdominal aortic aneurysms. Ann N Y Acad Sci. 2006;1085:339–352. - PubMed
-
- Absi TS, Sundt TM, 3rd, Tung WS, Moon M, Lee JK, Damiano RR, Jr., Thompson RW. Altered patterns of gene expression distinguishing ascending aortic aneurysms from abdominal aortic aneurysms: Complementary DNA expression profiling in the molecular characterization of aortic disease. J Thorac Cardiovasc Surg. 2003;126:344–357. - PubMed
-
- Hirsch AT, Haskal ZJ, Hertzer NR, Bakal CW, Creager MA, Halperin JL, Hiratzka LF, Murphy WR, Olin JW, Puschett JB, Rosenfield KA, Sacks D, Stanley JC, Taylor LM, Jr., White CJ, White J, White RA, Antman EM, Smith SC, Jr., Adams CD, Anderson JL, Faxon DP, Fuster V, Gibbons RJ, Hunt SA, Jacobs AK, Nishimura R, Ornato JP, Page RL, Riegel B. ACC/AHA 2005 practice guidelines for the management of patients with peripheral arterial disease (lower extremity, renal, mesenteric, and abdominal aortic) Circulation. 2006;113:e463–654. - PubMed
Publication types
MeSH terms
Grants and funding
LinkOut - more resources
Full Text Sources
Medical
