

Adaptation to heading direction dissociates the roles of human MST and V6 in the processing of optic flow
- PMID: 22592304
- PMCID: PMC3424094
- DOI: 10.1152/jn.00002.2012
Adaptation to heading direction dissociates the roles of human MST and V6 in the processing of optic flow
Abstract
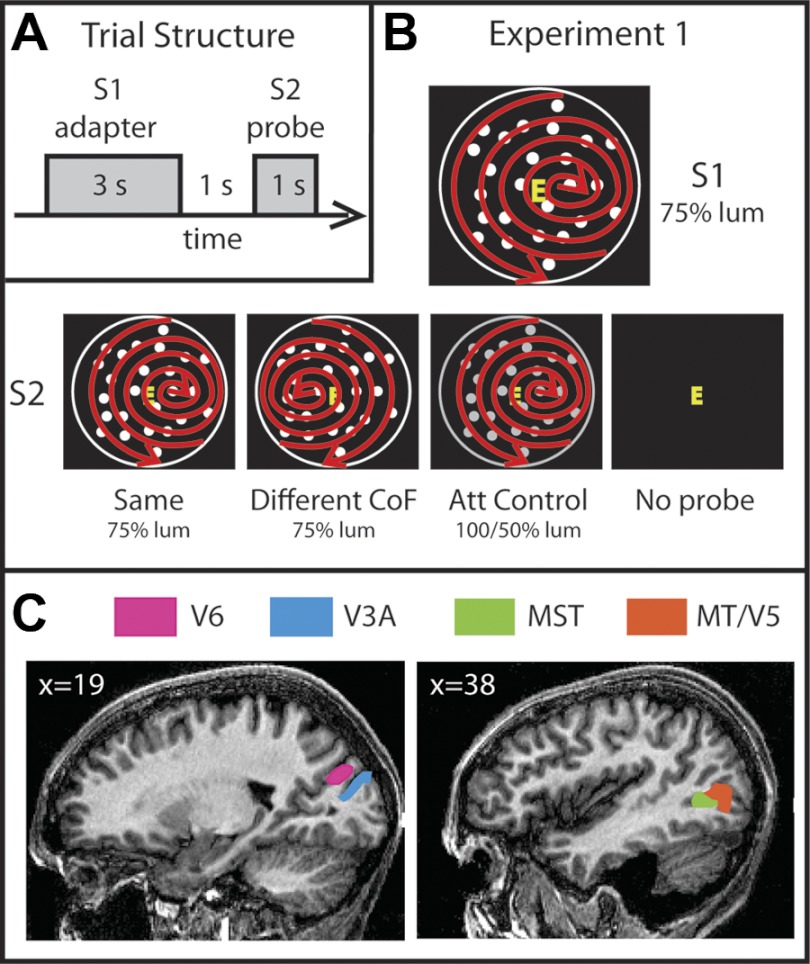
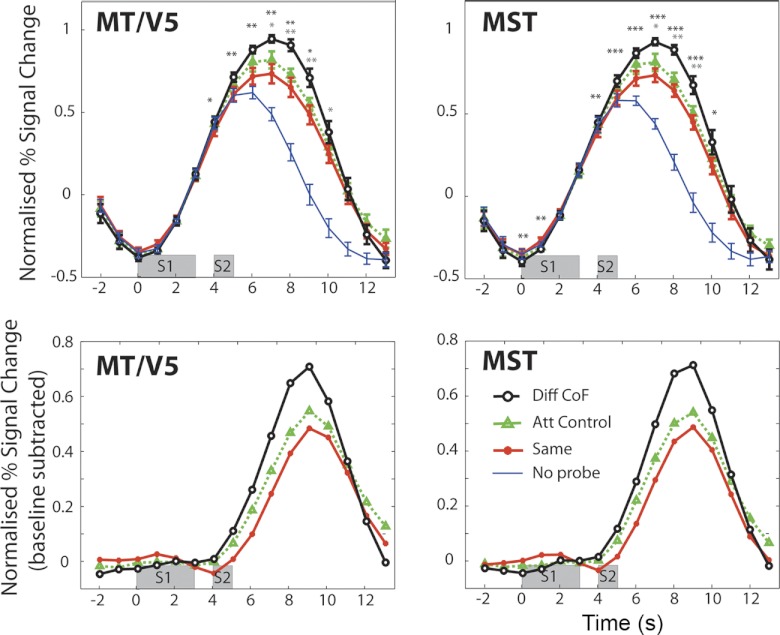
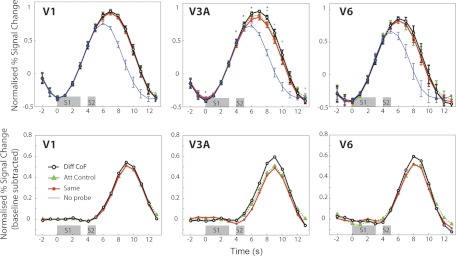
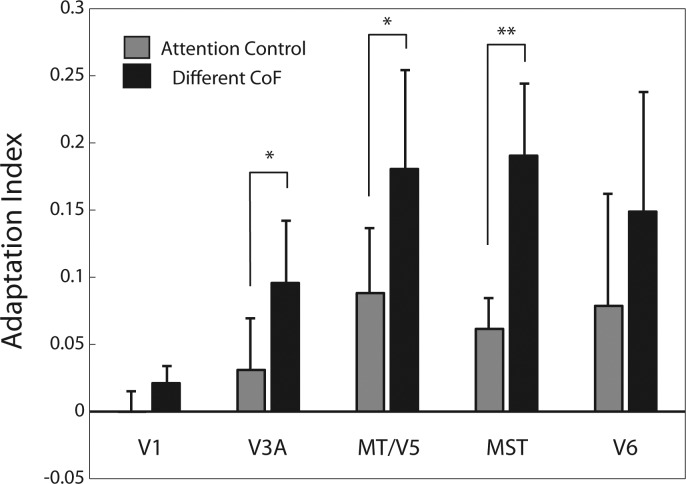
The extraction of optic flow cues is fundamental for successful locomotion. During forward motion, the focus of expansion (FoE), in conjunction with knowledge of eye position, indicates the direction in which the individual is heading. Therefore, it is expected that cortical brain regions that are involved in the estimation of heading will be sensitive to this feature. To characterize cortical sensitivity to the location of the FoE or, more generally, the center of flow (CoF) during visually simulated self-motion, we carried out a functional MRI (fMRI) adaptation experiment in several human visual cortical areas that are thought to be sensitive to optic flow parameters, namely, V3A, V6, MT/V5, and MST. In each trial, two optic flow patterns were sequentially presented, with the CoF located in either the same or different positions. With an adaptation design, an area sensitive to heading direction should respond more strongly to a pair of stimuli with different CoFs than to stimuli with the same CoF. Our results show such release from adaptation in areas MT/V5 and MST, and to a lesser extent V3A, suggesting the involvement of these areas in the processing of heading direction. The effect could not be explained either by differences in local motion or by attention capture. It was not observed to a significant extent in area V6 or in control area V1. The different patterns of responses observed in MST and V6, areas that are both involved in the processing of egomotion in macaques and humans, suggest distinct roles in the processing of visual cues for self-motion.
Figures
References
-
- Allman JM, Kaas JH. A representation of the visual field in the caudal third of the middle temporal gyrus of the owl monkey (Aotus trivirgatus). Brain Res 31: 85–105, 1971 - PubMed
-
- Ashida H, Lingnau A, Wall MB, Smith AT. fMRI adaptation reveals separate mechanisms for first-order and second-order motion. J Neurophysiol 97: 1319–1325, 2007 - PubMed
-
- Boynton GM, Demb JB, Glover GH, Heeger DJ. Neuronal basis of contrast discrimination. Vision Res 39: 257–269, 1999 - PubMed
-
- Brandt T, Bartenstein P, Janek A, Dieterich M. Reciprocal inhibitory visual-vestibular interaction—visual motion stimulation deactivates the parieto-insular vestibular cortex. Brain 121: 1749–1758, 1998 - PubMed
-
- Bremmer F, Duhamel JR, Hamed SB, Graf W. Heading encoding in the macaque ventral intraparietal area (VIP). Eur J Neurosci 16: 1554–1568, 2002 - PubMed
Publication types
MeSH terms
Grants and funding
LinkOut - more resources
Full Text Sources