. 2012 May 16;32(20):6967-80.
doi: 10.1523/JNEUROSCI.0025-12.2012.

S-SCAM/MAGI-2 is an essential synaptic scaffolding molecule for the GluA2-containing maintenance pool of AMPA receptors

Affiliations

S-SCAM/MAGI-2 is an essential synaptic scaffolding molecule for the GluA2-containing maintenance pool of AMPA receptors

Eric Danielson et al. J Neurosci. .

Abstract

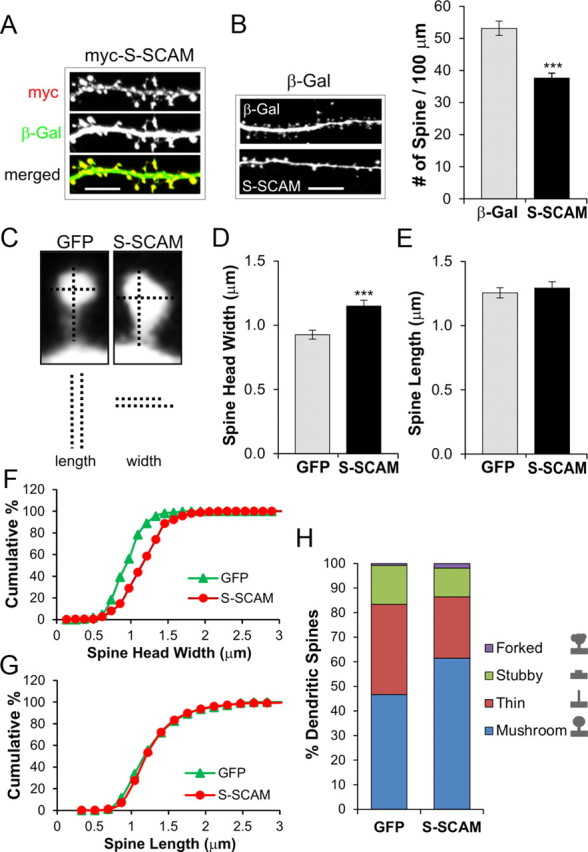
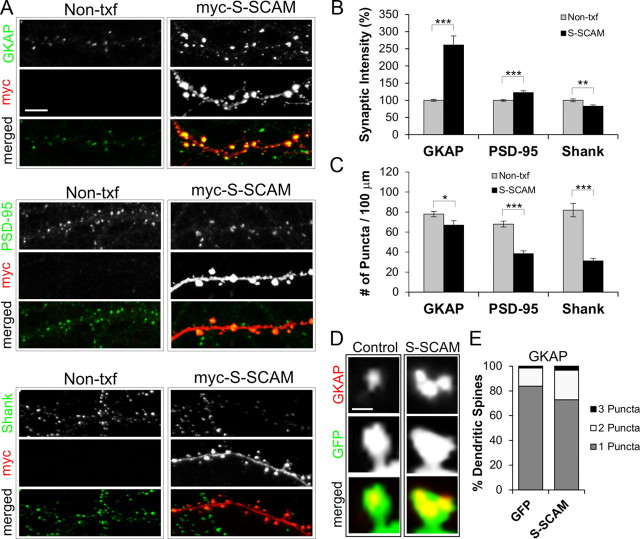
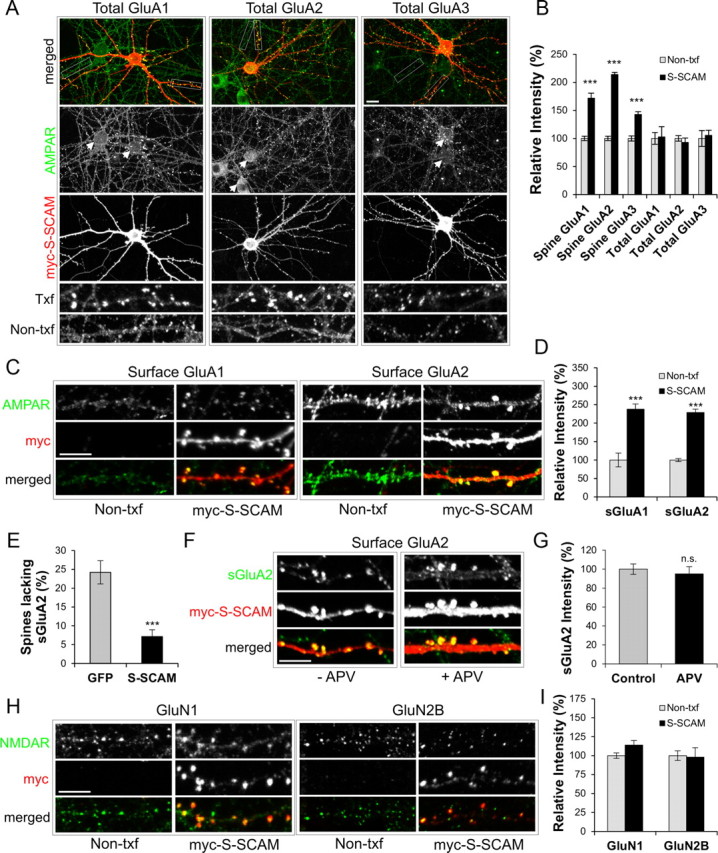
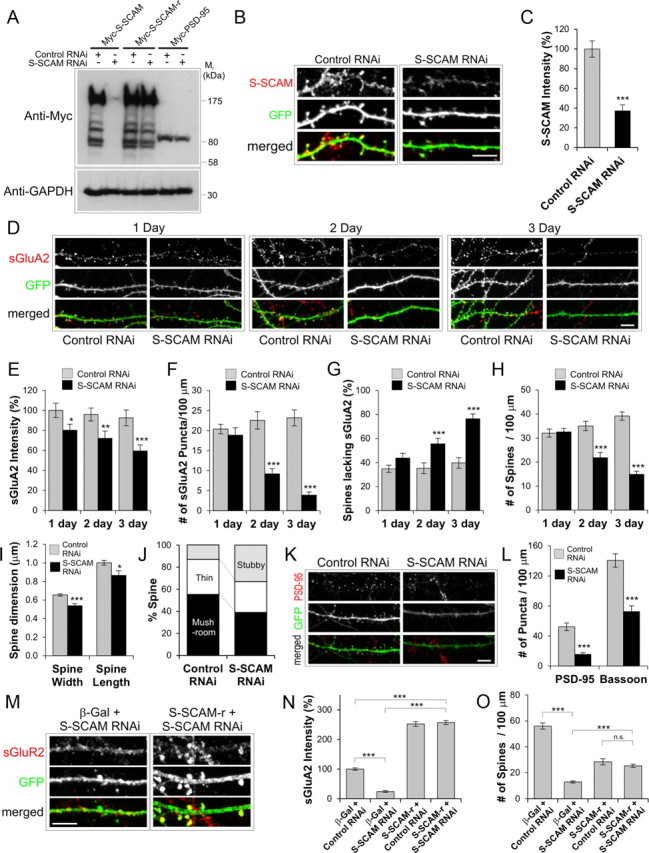
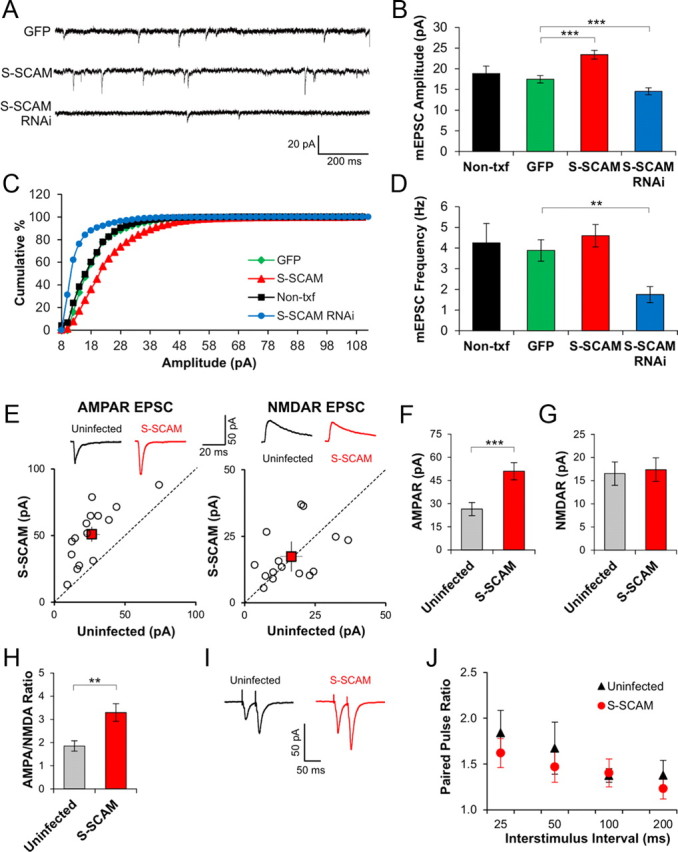
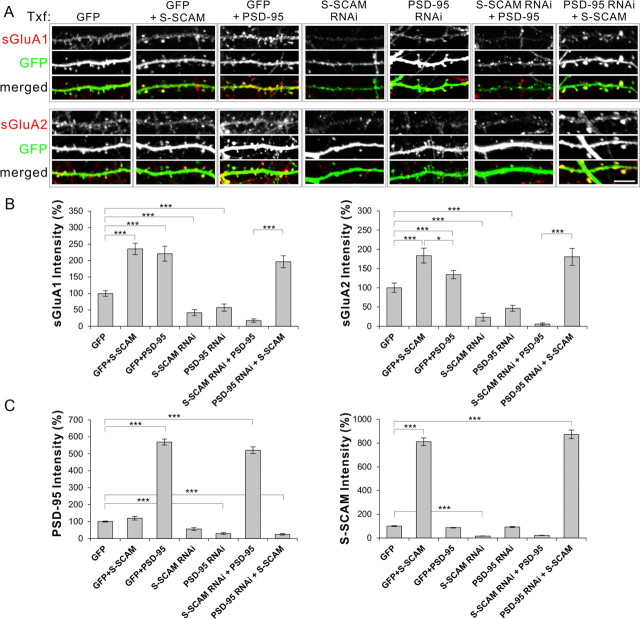
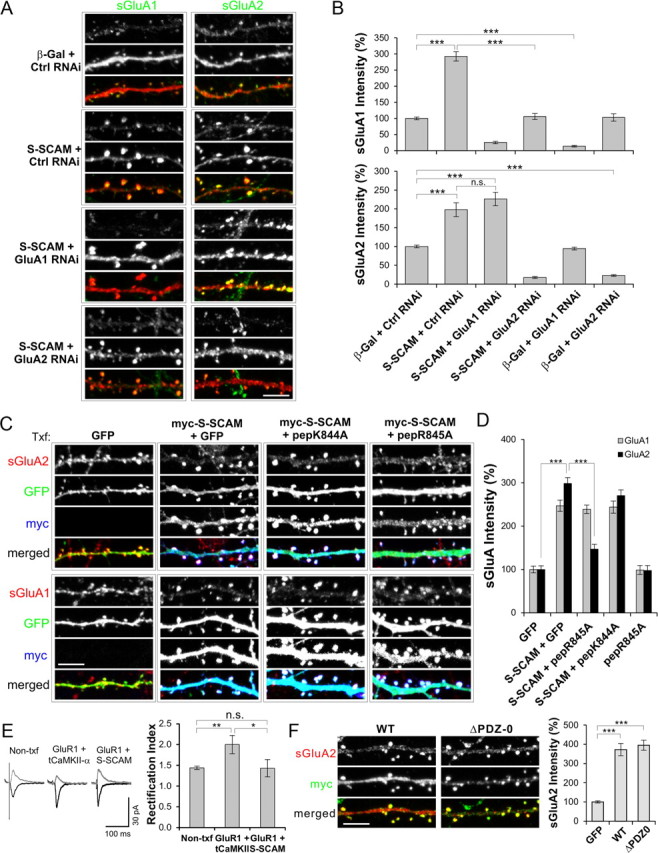
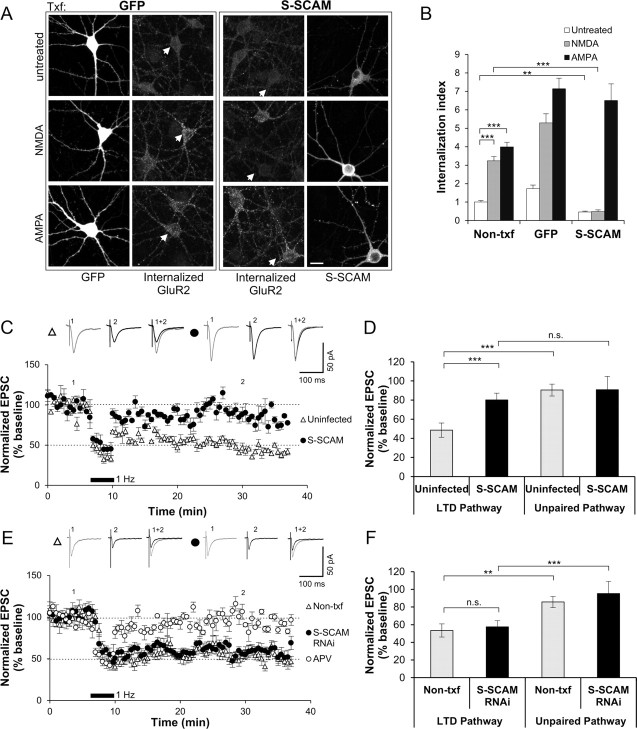
Synaptic plasticity, the cellular basis of learning and memory, involves the dynamic trafficking of AMPA receptors (AMPARs) into and out of synapses. One of the remaining key unanswered aspects of AMPAR trafficking is the mechanism by which synaptic strength is preserved despite protein turnover. In particular, the identity of AMPAR scaffolding molecule(s) involved in the maintenance of GluA2-containing AMPARs is completely unknown. Here we report that the synaptic scaffolding molecule (S-SCAM; also called membrane-associated guanylate kinase inverted-2 and atrophin interacting protein-1) plays the critical role of maintaining synaptic strength. Increasing S-SCAM levels in rat hippocampal neurons led to specific increases in the surface AMPAR levels, enhanced AMPAR-mediated synaptic transmission, and enlargement of dendritic spines, without significantly effecting GluN levels or NMDA receptor (NMDAR) EPSC. Conversely, decreasing S-SCAM levels by RNA interference-mediated knockdown caused the loss of synaptic AMPARs, which was followed by a severe reduction in the dendritic spine density. Importantly, S-SCAM regulated synaptic AMPAR levels in a manner, dependent on GluA2 not GluA1, sensitive to N-ethylmaleimide-sensitive fusion protein interaction, and independent of activity. Further, S-SCAM increased surface AMPAR levels in the absence of PSD-95, while PSD-95 was dependent on S-SCAM to increase surface AMPAR levels. Finally, S-SCAM overexpression hampered NMDA-induced internalization of AMPARs and prevented the induction of long term-depression, while S-SCAM knockdown did not. Together, these results suggest that S-SCAM is an essential AMPAR scaffolding molecule for the GluA2-containing pool of AMPARs, which are involved in the constitutive pathway of maintaining synaptic strength.


Figures

Figure 1.
Figure 1.
Effect of S-SCAM overexpression on the dendritic spines of hippocampal neurons. Hippocampal neurons were cotransfected with S-SCAM (myc-tagged) and β-gal or GFP, and their dendritic spines were analyzed. A, Representative images of dendrites from hippocampal neurons cotransfected with S-SCAM (red) and β-Gal (green), showing synaptic localization of S-SCAM. Scale bar, 5 μm. B, Effect of S-SCAM overexpression on dendritic spine density. Representative images of dendrites from neurons transfected with β-Gal alone (β-Gal, top) and S-SCAM + β-Gal (S-SCAM, bottom) are shown on the left and quantified spine density data are on the right. n > 20 per condition. ***p < 0.001. C, Representative images of dendritic spines from control (GFP only) or S-SCAM-transfected neurons. Vertical and horizontal dotted lines represent the length and width of dendritic spines, respectively. D, E, Effect of S-SCAM overexpression on the width (D) and length (E) of dendritic spines. F, G, Cumulative plot analyses of dendritic spine width (F) and length (G). p < 0.001 for width and p = 0.35 for length (K-S test). H, Changes in the morphology of dendritic spines after S-SCAM overexpression. Dendritic spines from >10 neurons per group were analyzed.
Figure 2.
Figure 2.
S-SCAM overexpression affects synaptic levels of PSD proteins. A, Representative images showing the effect of S-SCAM overexpression on GKAP (top), PSD-95 (middle), and Shank (bottom). Dendrites of nontransfected neighboring neurons (Non-txf) are compared with those of S-SCAM-transfected neurons. B, Quantification of intensity of synaptic puncta normalized to Non-txf neurons. C, Quantification of synaptic puncta density of PSD proteins. n > 25 per condition. D, Representative images demonstrating the effect of S-SCAM overexpression, versus GFP control, on the number of GKAP puncta present in a single dendritic spine. E, Quantification of the number of GKAP puncta per spine. ***p < 0.001, **p < 0.01, *p < 0.05 compared with Non-txf. Scale bars: A, 5 μm; D, 0.5 μm.
Figure 3.
Figure 3.
S-SCAM overexpression specifically increases AMPA-type glutamate receptors at synapses. A, Representative images showing the effect of S-SCAM (red) overexpression on total GluA1, GluA2, and GluA3 (green). Boxes indicate selected areas of dendrites used for expanded images of AMPAR staining shown at the bottom two rows. Arrowheads indicate soma of both Non-txf and transfected neurons. B, Quantification of relative intensities of total GluAs in dendritic spines (Spine GluAs) and in soma and dendrites (Total GluAs). C, Representative images showing the effect of S-SCAM (red) overexpression on surface GluA1 (sGluA1) and surface GluA2 (sGluA2). D, Quantification of relative intensities of surface GluRs in dendritic spines. E, Effect of S-SCAM overexpression on the percentage of dendritic spines lacking sGluA2 staining. n > 25 per condition. ***p < 0.001. F, G, Activity-independent increase of sGluA2 by S-SCAM. Representative images (F) showing the effect of S-SCAM overexpression on surface sGluA2 in neurons untreated (−APV) or treated with 100 μm APV (+APV). Quantification of relative intensities of sGluA2 in dendritic spines (G). H, Representative images showing the effect of S-SCAM overexpression on total GluN1 and GluN2B. I, Quantification of relative intensities of GluN1 and GluN2B puncta in Non-txf- and S-SCAM-transfected neurons. n > 25 per condition. ***p < 0.001. Scale bars: (wide view in A) 10 μm; (C,F,H) 5 μm.
Figure 4.
Figure 4.
S-SCAM knockdown by RNAi reduces surface AMPARs and led to the loss of dendritic spines. A–C, Specificity and efficacy of S-SCAM RNAi. A, COS cells were cotransfected with myc-S-SCAM, myc-S-CAM-r (RNAi-resistant S-SCAM), or myc-PSD-95 and S-SCAM RNAi or control RNAi (Zn-T3 RNAi). Note that S-SCAM RNAi reduced S-SCAM levels but had no significant effect on the S-SCAM-r and Myc-PSD-95. Anti-GAPDH blot is shown as a loading control. B, C, Efficient knockdown of endogenous S-SCAM by S-SCAM RNAi in hippocampal neurons. GFP (green) was coexpressed from the RNAi expression plasmid and used as transfection marker. Representative images are shown in B, and quantification of data are provided in C. D, Represents images showing the time course of S-SCAM RNAi effect on sGluA2 (red) levels. E–J, Quantification of the effect of S-SCAM RNAi on sGluA2 intensity (E), the density of sGluA2 puncta (F), percentage of dendritic spines lacking sGluA2 staining (G), dendritic spine density (H), dendritic spine dimension (I), and dendritic spine morphology (J). K, L, Effect of S-SCAM RNAi on PSD-95 and Bassoon clusters (red). Representative results are shown in K. Quantification of the S-SCAM RNAi effect on the density of PSD-95 and Bassoon clusters is shown in L. M–O, Rescue experiments with S-SCAM-r. Representative images of neurons cotransfected with S-SCAM RNAi and S-SCAM-r stained for sGluA2 and GFP (M). Quantification of the rescue experiments for sGluA2 intensity (N) and dendritic spine density (O). n > 25 per condition. ***p < 0.001, **p < 0.01, *p < 0.05. Scale bar, 5 μm.
Figure 5.
Figure 5.
Changing S-SCAM levels modulate AMPAR-mediated synaptic transmission. A, Representative traces of AMPAR mEPSCs measured after transfecting dissociated hippocampal culture neurons with GFP, S-SCAM, or S-SCAM RNAi. B, Bar graph showing average mEPSC amplitudes of each group. ***p < 0.001 and n > 10 per condition. C, Cumulative histograms of mEPSC amplitudes in Non-txf, GFP-, S-SCAM-, or S-SCAM RNAi-transfected neurons. p = 0.46 for Non-txf vs GFP and p < 0.001 for GFP versus S-SCAM and GFP versus S-SCAM RNAi (K-S test). D, Bar chart showing average mEPSC frequency of each group. **p < 0.01, n > 10 per condition. E–H, Enhanced AMPAR-mediated EPSCs after S-SCAM overexpression in pyramidal CA1 neurons of cultured hippocampal slices. Synaptic currents were simultaneously recorded from neurons infected with sindbis virus-expressing GFP-S-SCAM (S-SCAM) and uninfected nearby pyramidal neurons (uninfected) held at −60 or +40 mV. E, Top, Sample recording traces mediated by AMPAR and NMDAR. Quantification of AMPAR EPSC amplitudes and NMDAR EPSC amplitudes are plotted for each pair of S-SCAM-infected and -uninfected nearby cells. Each open circle represents a single pair of recording. Mean ± SEM is shown by closed red squares. Bar graphs for AMPA EPSC (F) and NMDAR EPSC (G). ***p < 0.001 and n = 15 per group. H, Bar graph of AMPA/NMDA ratio showing an increased AMPA/NMDA ratio in S-SCAM-infected neurons.**p < 0.005 (paired t test). I, J, PPR of S-SCAM-infected and -uninfected neurons measured using pairs of stimulation pulses separated by various intervals. Representative traces of PPR at 50 ms interval are shown in I and quantified PPR data are shown in J. n = 10 per group.
Figure 6.
Figure 6.
S-SCAM regulates AMPAR levels independently of PSD-95. Hippocampal neurons were transfected with GFP alone, GFP + S-SCAM, GFP + PSD-95, S-SCAM RNAi alone, PSD-95 RNAi alone, S-SCAM RNAi + PSD-95, or PSD-95 RNAi + S-SCAM. Transfected neurons were visualized by GFP fluorescence (RNAi vectors coexpress GFP) and analyzed for sGluA1 or sGluA2 staining. Scale bar, 5 μm. A, Representative images from each group showing sGluA (red) and GFP staining (green). B, Quantification of relative intensities of surface GluAs in dendritic spines. C, Quantification of relative intensities of PSD-95 and S-SCAM in dendritic spines. n > 20 per group. ***p < 0.001, *p < 0.05.
Figure 7.
Figure 7.
S-SCAM regulates AMPARs through GluA2 subunit. A, B, Effect of GluA1- or GluA2-specific RNAi on S-SCAM overexpression-induced increase of AMPAR. Hippocampal neurons were transfected with β-Gal + Control RNAi, S-SCAM + Control RNAi, S-SCAM + GluA1 RNAi, or S-SCAM + GluA2 RNAi and immunostained for sGluA1 and sGluA2. Representative images are shown in A and quantification is provided as bar graphs in B. Note that S-SCAM failed to increase sGluA1 levels in the presence of GluA2 RNAi, while S-SCAM increased sGluA2 levels in the presence of GluA1RNAi. ***p < 0.001 and n > 20 per condition. C, D, Effect of NSF-interaction blocking peptides on S-SCAM-induced increase of surface AMPAR levels. Hippocampal neurons were transfected with GFP alone, S-SCAM + GFP, S-SCAM + GFP-pepK844A, or S-SCAM + GFP-pepR845A and examined for sGluA1 and sGluA2 levels. Representative images are shown in C and quantified data are shown in D. Scale bar, 5 μm. ***p < 0.001 and n >25 per condition. E, Bar graph showing rectification index of neurons transfected with GluR1 + S-SCAM or GluR1 + tCaMKII-α. Control represents untransfected neighboring neurons. **p < 0.01, *p < 0.05. n >15 per condition. F, Effect of PDZ-0 domain deletion on sGluA2 levels in hippocampal neurons. ***p < 0.001, n = 30 per condition.
Figure 8.
Figure 8.
S-SCAM overexpression blocks NMDA-induced AMPAR internalization and induction of hippocampal LTD. A, B, Effect of S-SCAM on AMPAR internalization. GFP or S-SCAM was transfected into hippocampal neurons and their effect on GluA2 internalization was measured by a fluorescence-based antibody-feeding assay. Neurons were stimulated for 2 min with conditioned media (Control), 50 μm NMDA, or 100 μm AMPA. Representative images are shown in A and quantified data are presented in B. Scale bar, 10 μm. n > 25 per condition. ***p < 0.001, **p < 0.01. Scale bar represents 10 μm. C, D, Effect of S-SCAM overexpression on hippocampal LTD. CA1 neurons were infected with sindbis virus-expressing GFP or GFP-S-SCAM. Paired recordings were performed in infected and uninfected nearby neurons. LTD was induced by pairing 200 pulses of 1 Hz stimulation and postsynaptic depolarization at −40 mV. Normalized EPSC traces are shown in C and quantified in D. While uninfected control neurons show normal pathway-specific LTD (LTD vs unpaired pathway, ***p < 0.001, n = 10), LTD induction was blocked in neurons infected with SCAM (p = 0.42, n = 10). E, F, Effect of APV and S-SCAM knockdown on the hippocampal LTD formation. Normalized EPSC traces are shown in E and bar graphs are in F (n = 6 for APV and n = 10 for other conditions).

References

    1. Béïque JC, Andrade R. PSD-95 regulates synaptic transmission and plasticity in rat cerebral cortex. J Physiol. 2003;546:859–867. - PMC - PubMed
    1. Bhattacharyya S, Biou V, Xu W, Schlüter O, Malenka RC. A critical role for PSD-95/AKAP interactions in endocytosis of synaptic AMPA receptors. Nat Neurosci. 2009;12:172–181. - PMC - PubMed
    1. Buxbaum JD, Georgieva L, Young JJ, Plescia C, Kajiwara Y, Jiang Y, Moskvina V, Norton N, Peirce T, Williams H, Craddock NJ, Carroll L, Corfas G, Davis KL, Owen MJ, Harroch S, Sakurai T, O'Donovan MC. Molecular dissection of NRG1-ERBB4 signaling implicates PTPRZ1 as a potential schizophrenia susceptibility gene. Mol Psychiatry. 2008;13:162–172. - PMC - PubMed
    1. Collingridge GL, Isaac JT, Wang YT. Receptor trafficking and synaptic plasticity. Nat Rev Neurosci. 2004;5:952–962. - PubMed
    1. Deng F, Price MG, Davis CF, Mori M, Burgess DL. Stargazin and other transmembrane AMPA receptor regulating proteins interact with synaptic scaffolding protein MAGI-2 in brain. J Neurosci. 2006;26:7875–7884. - PMC - PubMed

Publication types

MeSH terms

Substances