. 2012 Jul;23(13):2560-70.
doi: 10.1091/mbc.E11-07-0651. Epub 2012 May 16.

Tension-dependent nucleosome remodeling at the pericentromere in yeast

Affiliations

Tension-dependent nucleosome remodeling at the pericentromere in yeast

Jolien S Verdaasdonk et al. Mol Biol Cell. 2012 Jul.

Abstract

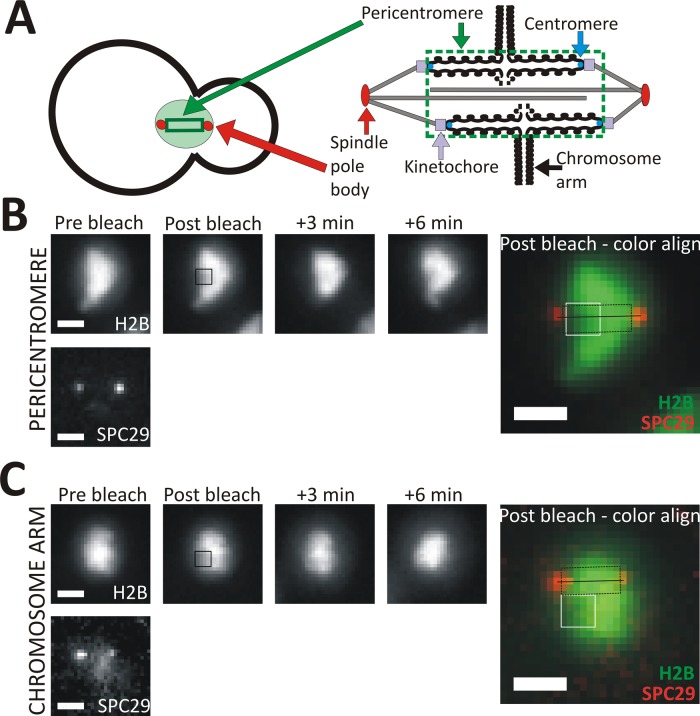
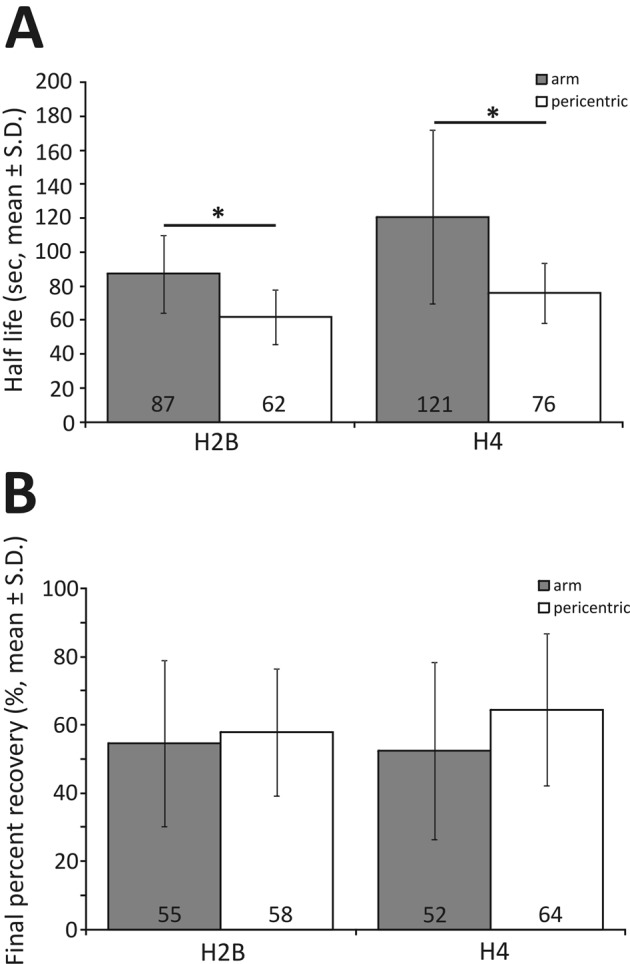
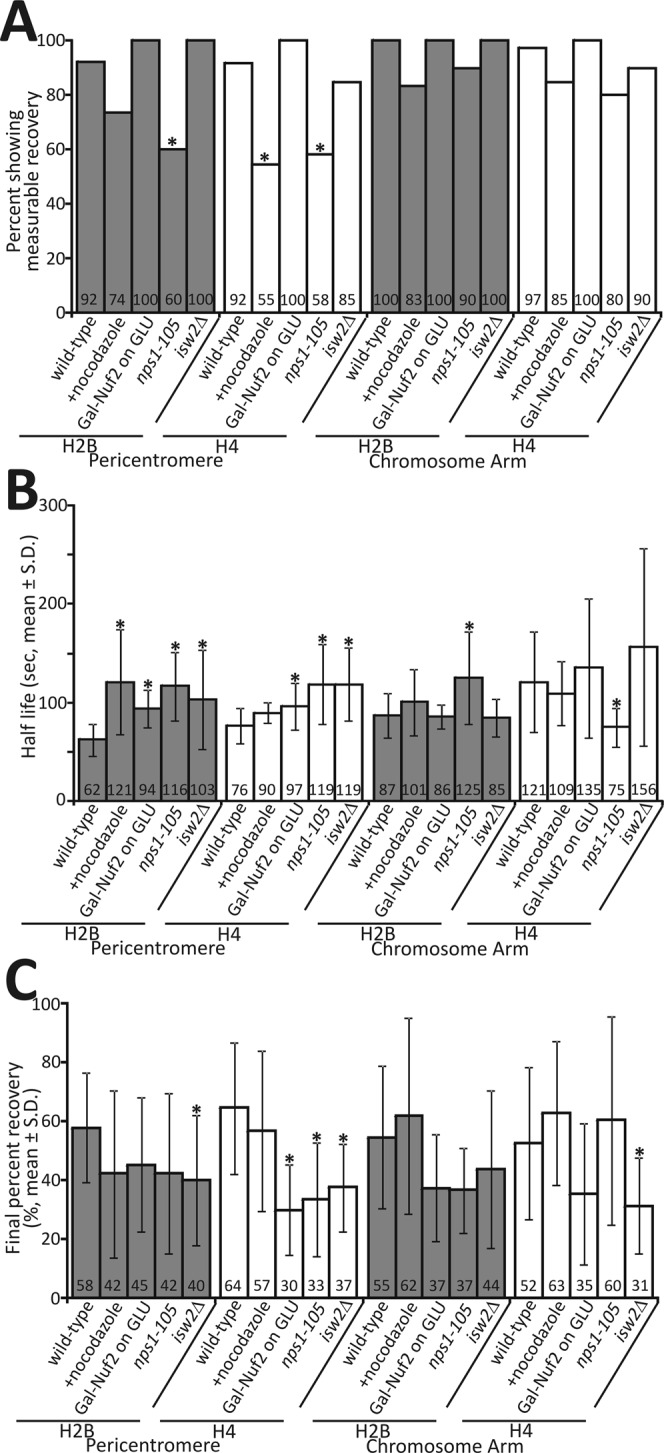
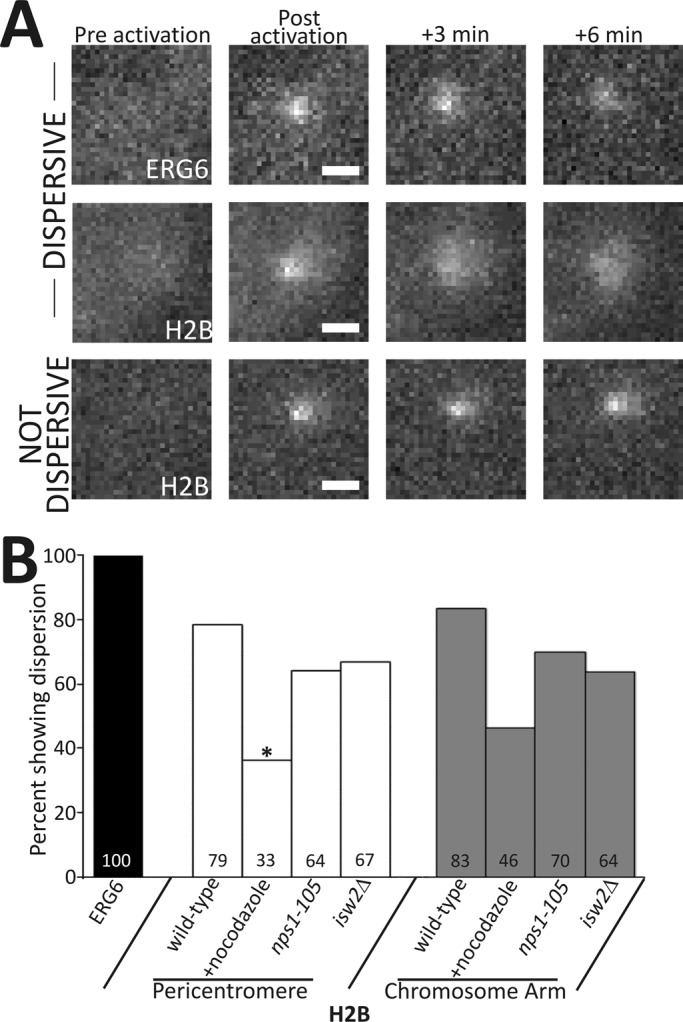
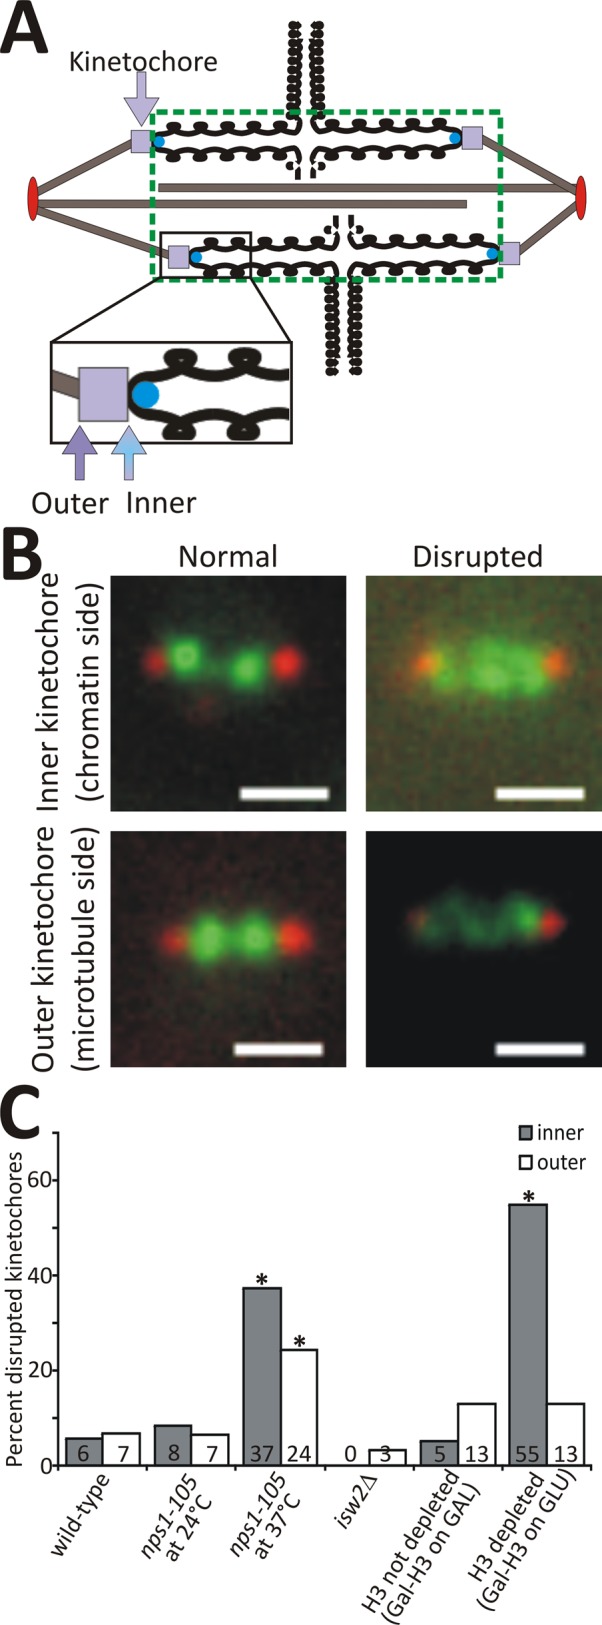
Nucleosome positioning is important for the structural integrity of chromosomes. During metaphase the mitotic spindle exerts physical force on pericentromeric chromatin. The cell must adjust the pericentromeric chromatin to accommodate the changing tension resulting from microtubule dynamics to maintain a stable metaphase spindle. Here we examine the effects of spindle-based tension on nucleosome dynamics by measuring the histone turnover of the chromosome arm and the pericentromere during metaphase in the budding yeast Saccharomyces cerevisiae. We find that both histones H2B and H4 exhibit greater turnover in the pericentromere during metaphase. Loss of spindle-based tension by treatment with the microtubule-depolymerizing drug nocodazole or compromising kinetochore function results in reduced histone turnover in the pericentromere. Pericentromeric histone dynamics are influenced by the chromatin-remodeling activities of STH1/NPS1 and ISW2. Sth1p is the ATPase component of the Remodels the Structure of Chromatin (RSC) complex, and Isw2p is an ATP-dependent DNA translocase member of the Imitation Switch (ISWI) subfamily of chromatin-remodeling factors. The balance between displacement and insertion of pericentromeric histones provides a mechanism to accommodate spindle-based tension while maintaining proper chromatin packaging during mitosis.


Figures

FIGURE 1:
FIGURE 1:
In vivo photobleaching of the pericentromere and chromosome arm, using spindle pole bodies as fiduciary markers. (A) Diagram showing the organization of the pericentromeric chromatin in budding yeast (Yeh et al., 2008). The pericentromere is defined by the region of cohesin enrichment between the spindle pole bodies. (B, C) Representative images of FRAP experiments in the pericentromere (B) and chromosome arm (C). Shown is the histone-GFP signal before photobleaching, postphotobleaching (with bleached area outlined by black square), 3 min postphotobleaching, and 6 min postphotobleaching. The color align image shows the spindle pole bodies (Spc29p-RFP) relative to the postphotobleaching H2B-GFP, with location of bleaching denoted by the 5 × 5 pixel white square. The spindle axis (solid black line) and the pericentromere (dotted black line) are shown in relation to the photobleached spot. Bar, 1 μm.
FIGURE 2:
FIGURE 2:
Histones in the pericentromere are more dynamic than those of the chromosome arm. (A) Graph of average half-life in seconds measured by FRAP for histones H2B and H4 in the pericentromere and chromosome arm. Asterisks indicate statistically significant differences (Student's t test, p < 0.05) between arm and pericentromere regions for each histone. All data are summarized in Supplemental Tables S1 (H2B) and S2 (H4). Normalized FRAP recovery curves are shown in Supplemental Figure S2. (B) Graph of final percentage recovery of histone fluorescence signal after photobleaching. Final percentage recovery reflects the amount of mobile protein that exhibited fluorescence recovery. These values are not statistically significantly different (Student's t test, p < 0.05). Graph, mean ± SD.
FIGURE 3:
FIGURE 3:
Loss of spindle tension or chromatin-remodeling activity results in reduced histone dynamics primarily at the pericentromere. (A) Graph showing percentage of samples showing measurable recovery after photobleaching. Samples whose final percentage recovery was >0% were defined as not showing measurable recovery. Asterisks indicate statistically significant differences between sample and corresponding wild-type value (Fisher's exact test, p < 0.05). (B) Graph of average histone half-life (seconds). nps1-105 at permissive temperature (24°C). (C) Graph of final histone fluorescence percentage recovery, reflecting the mobile protein exhibiting recovery over the course of the time lapse. For both B and C, asterisks indicate statistically significant differences between sample and corresponding wild-type value (Student's t test, p < 0.05). All data (including sample sizes) are summarized in Supplemental Tables S1 (H2B) and S2 (H4). Graph, mean ± SD.
FIGURE 4:
FIGURE 4:
Loss of spindle tension results in reduced dispersal of photoactivated histone H2B. (A) Representative images showing nuclear region before photoactivation (preactivation), postphotoactivation, halfway through time lapse (+3 min), and at end of time lapse (+6 min). Top row, the dispersion of the control strain containing Erg6p-paGFP. Second and third rows, representative images of dispersive (row 2) and not dispersive (row 3) H2B-paGFP. Bar, 1 μm. (B) Percentage of cells showing dispersion of photoactivated Erg6p or H2B in the arm and pericentromere (wild-type = untreated, nps1-105 at permissive temperature [24°C]). Dispersion is defined by the loss of fluorescence intensity over the course of the time lapse (Materials and Methods). Asterisks indicate statistically significant differences between sample and corresponding wild-type value (Fisher's exact test, p < 0.05; Supplemental Table S3). Percentage showing dispersion in the chromosome arm upon nocodazole treatment is approaching statistical significance (p < 0.1).
FIGURE 5:
FIGURE 5:
Disruption of the underlying chromatin platform results in disruption of the kinetochore. (A) Diagram of kinetochore location in relation to pericentromeric chromatin, as denoted by green dotted line. (B) Representative images of both normal and disrupted kinetochores. Either inner kinetochore (Ame1p-GFP) or outer kinetochore (Spc24p-GFP) is shown in green, and spindle pole bodies (Spc29p-RFP) are shown in red. Bar, 1 μm. (C) Graph showing percentage of kinetochores disrupted in single plane images. For wild-type cells, we imaged Ame1p-GFP for the inner kinetochore or Nuf2p-GFP for the outer kinetochore. nps1-105 and isw2Δ cells contained either Ame1p-GFP (inner) or Spc24p-GFP (outer). Gal-H3 cells contained either Ndc10p-GFP (inner) or Nuf2p-GFP (outer). The disrupted phenotype observed in the inner kinetochore varied from declustered (nps1-105) to a more diffusive cloud (H3 depleted). Asterisks indicate statistically significant differences between sample and corresponding wild-type value (Fisher's exact test, p < 0.05; Supplemental Table S4).
FIGURE 6:
FIGURE 6:
Model diagram of histone occupancy in the pericentromere and arm under various experimental conditions. (A) Diagram of replicated bioriented chromosome indicating the locations of the arm and the pericentromere in relation to the centromere and kinetochore. (B) In wild-type cells, histones are more dynamic in the pericentromere than the arm (illustrated by larger arrows at the pericentromere), which is the result of being replaced more rapidly in the pericentromere. Histone on and off rates are balanced (equal-sized arrows) to maintain proper histone occupancy. (C) On loss of spindle tension, histones are not removed as frequently from pericentromeric chromatin, and the arm is unaffected. (D) Loss of RSC function results in reduced histone dynamics (slower reloading) at the pericentromere and slower histone dynamics throughout the nucleus. Kinetochores appear disrupted due to disturbance of the underlying chromatin structure required for kinetochore organization. (E) Loss of ISW2 results in slower histone dynamics at the pericentromere, likely due to disrupted histone reloading, whereas the chromosome arm is unaffected.

References

    1. Ahmad K, Henikoff S. The histone variant H3.3 marks active chromatin by replication-independent nucleosome assembly. Mol Cell. 2002;9:1191–1200. - PubMed
    1. Akey CW, Luger K. Histone chaperones and nucleosome assembly. Curr Opin Struct Biol. 2003;13:6–14. - PubMed
    1. Anderson M, Haase J, Yeh E, Bloom K. Function and assembly of DNA looping, clustering, and microtubule attachment complexes within a eukaryotic kinetochore. Mol Biol Cell. 2009;20:4131–4139. - PMC - PubMed
    1. Bi E, Pringle JR. ZDS1 and ZDS2, genes whose products may regulate Cdc42p in Saccharomyces cerevisiae. Mol Cell Biol. 1996;16:5264–5275. - PMC - PubMed
    1. Biggins S, Murray AW. The budding yeast protein kinase Ipl1/Aurora allows the absence of tension to activate the spindle checkpoint. Genes Dev. 2001;15:3118–3129. - PMC - PubMed

Publication types

MeSH terms

LinkOut - more resources