. 2012 Oct;22(10):2043-53.
doi: 10.1101/gr.134833.111. Epub 2012 May 16.

Dynamics of enhancer chromatin signatures mark the transition from pluripotency to cell specification during embryogenesis

Affiliations

Dynamics of enhancer chromatin signatures mark the transition from pluripotency to cell specification during embryogenesis

Ozren Bogdanovic et al. Genome Res. 2012 Oct.

Abstract

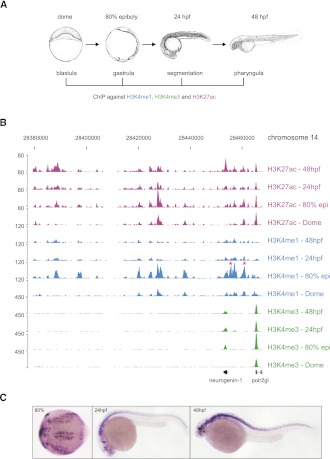
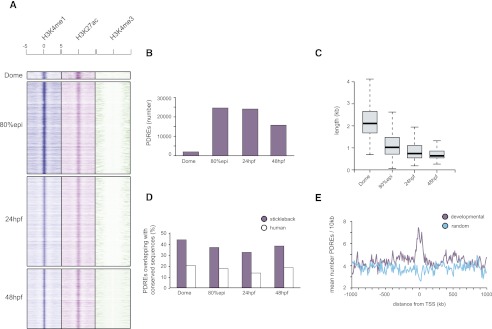
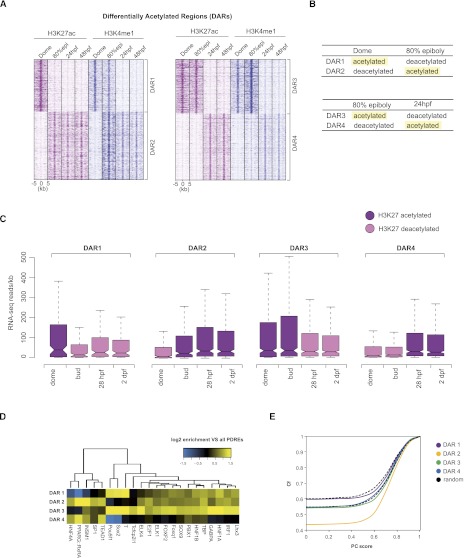
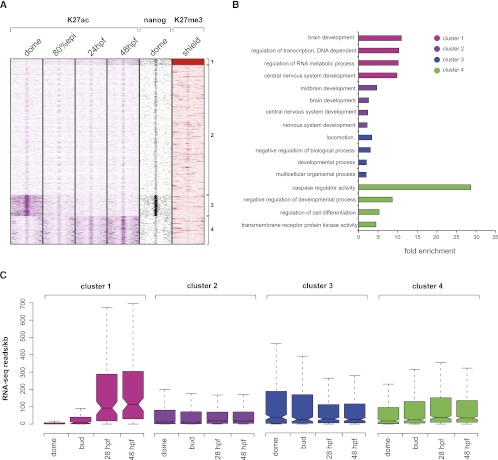
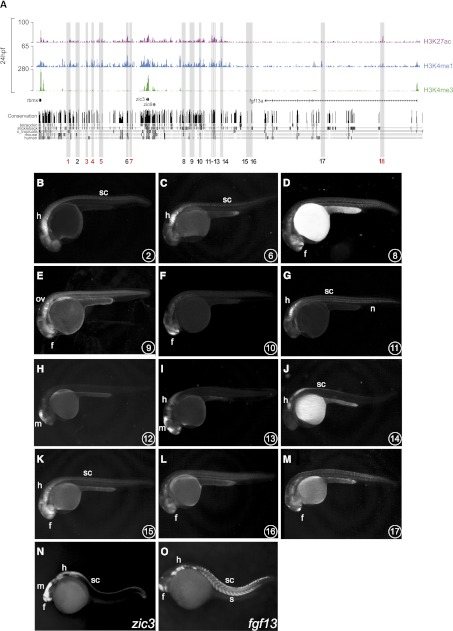
The generation of distinctive cell types that form different tissues and organs requires precise, temporal and spatial control of gene expression. This depends on specific cis-regulatory elements distributed in the noncoding DNA surrounding their target genes. Studies performed on mammalian embryonic stem cells and Drosophila embryos suggest that active enhancers form part of a defined chromatin landscape marked by histone H3 lysine 4 mono-methylation (H3K4me1) and histone H3 lysine 27 acetylation (H3K27ac). Nevertheless, little is known about the dynamics and the potential roles of these marks during vertebrate embryogenesis. Here, we provide genomic maps of H3K4me1/me3 and H3K27ac at four developmental time-points of zebrafish embryogenesis and analyze embryonic enhancer activity. We find that (1) changes in H3K27ac enrichment at enhancers accompany the shift from pluripotency to tissue-specific gene expression, (2) in early embryos, the peaks of H3K27ac enrichment are bound by pluripotent factors such as Nanog, and (3) the degree of evolutionary conservation is higher for enhancers that become marked by H3K27ac at the end of gastrulation, suggesting their implication in the establishment of the most conserved (phylotypic) transcriptome that is known to occur later at the pharyngula stage.


Figures

Figure 1.
Figure 1.
Genomic locations of H3K27ac, H3K4me1, and H3K4me3. (A) A schematic representation of zebrafish early development. H3K4me1/me3 and H3K27ac were immunoprecipitated at the described stages. (B) UCSC Genome Browser view of H3K27ac, H3K4me1, and H3K4me3 tracks obtained for four zebrafish developmental stages: dome, 80% epiboly, 24 hpf, 48 hpf. (Red asterisks) Previously described neurog1 enhancers. (C) Endogenous expression pattern of neurog1 at 80% epiboly, 24-hpf, and 48-hpf zebrafish embryos driven by H3K4me1/H3K27ac-marked transcriptional enhancers. The transcript is localized along the central nervous system (forebrain, midbrain, hindbrain, and spinal cord).
Figure 2.
Figure 2.
Characteristics of identified putative distal regulatory elements. (A) Heat maps showing the distribution of H3K4me1/me3 and H3K27ac tags −5kb/+5kb relative to the PDRE center at four developmental stages. (B) The number of PDREs identified at dome (blastula) stage is considerably lower than the number of PDREs identified at 80% epiboly or 24/48 hpf, in line with reduced tissue complexity of blastula embryos. (C) Box plots showing the distribution of PDRE length at four examined developmental stages. The PDREs identified at dome stage are considerably larger than the ones identified at subsequent stages, possibly due to a more relaxed chromatin conformation present during early embryogenesis. (D) Conservation of identified PDREs as judged by genomic overlaps with regions conserved to teleosts (sticklebacks) and humans. Approximately 40% and 20% of PDREs overlap with regions conserved in sticklebacks and humans, respectively. (E) The identified PDREs are significantly enriched (Kolmogorov-Smirnov test, P-value < 0.00001) for developmental genes, indicative of a role these sequences might play in early development.
Figure 3.
Figure 3.
H3K27 differentially acetylated regions. (A) K-means clustering (k = 2) of regions differentially acetylated between subsequent developmental stages. The H3K4me1 mark follows the dynamics of H3K27ac; however, it disappears after H3K27ac has already disappeared (DAR1) (left panel). Similarly to regions differentially acetylated between dome and 80% epiboly, in later DARs, the H3K4me1 mark follows H3K27ac and even precedes H3K27ac on certain genomic locations (DAR4). (B) A schematic representation of different DARs; terms “acetylated” and “deacetylated” correspond to genomic locations identified by Fisher's exact test as differentially enriched for H3K27ac between two subsequent stages. (C) Distribution of gene expression intensities (RNA-seq reads normalized for gene length) displays an overall positive correlation with H3K27ac deposition on enhancer elements at all stages. The H3K27 acetylated DARs are found in the vicinity of highly expressed genes. (D) Hierarchical clustering of motif occurrence in differentially acetylated regions. The frequency of all JASPAR vertebrate motifs in the four DAR clusters was compared to the frequency in all PDREs. All motifs significantly overrepresented (P < 0.05, hypergeometric test in combination with Benjamini-Hochberg correction) in at least one DAR cluster were combined and clustered. (Yellow) Overrepresentation compared to all PDREs; (blue) underrepresentation. (E) Cumulative frequency (Cf) of DARs was plotted against average phastCons (PC) conservation scores that were calculated for each DAR. Each point on the graph represents the frequency of DARs with that of a lower PC score. The frequency of dome (−) 80% epi (+) DARs with a PC score 0 is 0.43, whereas that number is considerably higher (0.59) for dome (+) 80% epi (−) DARs, making them, therefore, less conserved. The black dotted lines correspond to the range of conservation of random DNA.
Figure 4.
Figure 4.
Clustering of H3K27ac, H3K27me3, and Nanog over poised (only H3K4me1-marked) enhancers at 80% epiboly. (A) K-means clustering (k = 4) identifies four groups of regulatory elements. The first group is enhancers marked by H3K27me3 that gain H3K27ac as the development proceeds. The second group corresponds to elements that remain poised during early development. The third and the fourth group correspond to elements that gain or lose H3K27ac, respectively. Zebrafish Nanog-like factor displays strong enrichment over early active (H3K27ac) enhancers. (B) GO analysis of nearest neighbor genes associated to each cluster. Only the four entries displaying highest enrichments are shown (P-value cut-off = 0.01). (C) Distribution of gene expression intensities (RNA-seq reads normalized for gene length) associated with each cluster. As previously shown, an overall positive correlation exists between expression intensity and enhancer H3K27ac levels.
Figure 5.
Figure 5.
Enhancer activity of PDREs analyzed in stable (F1) zebrafish transgenic lines. (A) Distribution of H3K4me3, H3K4me1, and H3K27ac tracks along 500 kb spanning the zic3 locus at 24 hpf. Shaded in gray are 18 PDREs assayed for enhancer activity in zebrafish transgenic embryos. These PDREs show different degrees of evolutionary conservation as indicated by the conservation tracks below. Out of 18 tested regions, six regions did not exhibit enhancer activity (red numbers). (B–O) Lateral views of 24-hpf zebrafish embryos. (B–M) GFP expression driven by the PDREs indicated in the lower right corner of each panel. (N,O) Expression patterns of zic3 and fgf13a genes at the same stage. Forebrain (f); midbrain (m); hindbrain (h); otic vesicle (ov); spinal cord (sc), notochord (n) and somites (s).

Similar articles

Cited by

References

    1. Aday AW, Zhu LJ, Lakshmanan A, Wang J, Lawson ND 2011. Identification of cis regulatory features in the embryonic zebrafish genome through large-scale profiling of H3K4me1 and H3K4me3 binding sites. Dev Biol 357: 450–462 - PMC - PubMed
    1. Bauer S, Grossmann S, Vingron M, Robinson PN 2008. Ontologizer 2.0—a multifunctional tool for GO term enrichment analysis and data exploration. Bioinformatics 24: 1650–1651 - PubMed
    1. Bessa J, Tena JJ, de la Calle-Mustienes E, Fernandez-Minan A, Naranjo S, Fernandez A, Montoliu L, Akalin A, Lenhard B, Casares F, et al. 2009. Zebrafish enhancer detection (ZED) vector: A new tool to facilitate transgenesis and the functional analysis of cis-regulatory regions in zebrafish. Dev Dyn 238: 2409–2417 - PubMed
    1. Blader P, Lam CS, Rastegar S, Scardigli R, Nicod JC, Simplicio N, Plessy C, Fischer N, Schuurmans C, Guillemot F, et al. 2004. Conserved and acquired features of neurogenin1 regulation. Development 131: 5627–5637 - PubMed
    1. Blankenberg D, Taylor J, Schenck I, He J, Zhang Y, Ghent M, Veeraraghavan N, Albert I, Miller W, Makova KD, et al. 2007. A framework for collaborative analysis of ENCODE data: Making large-scale analyses biologist-friendly. Genome Res 17: 960–964 - PMC - PubMed

Publication types

Associated data