. 2012 Jul 13;287(29):24754-64.
doi: 10.1074/jbc.M112.357012. Epub 2012 May 16.

Carbon monoxide mediates the anti-apoptotic effects of heme oxygenase-1 in medulloblastoma DAOY cells via K+ channel inhibition

Affiliations

Carbon monoxide mediates the anti-apoptotic effects of heme oxygenase-1 in medulloblastoma DAOY cells via K+ channel inhibition

Moza M A Al-Owais et al. J Biol Chem. .

Abstract

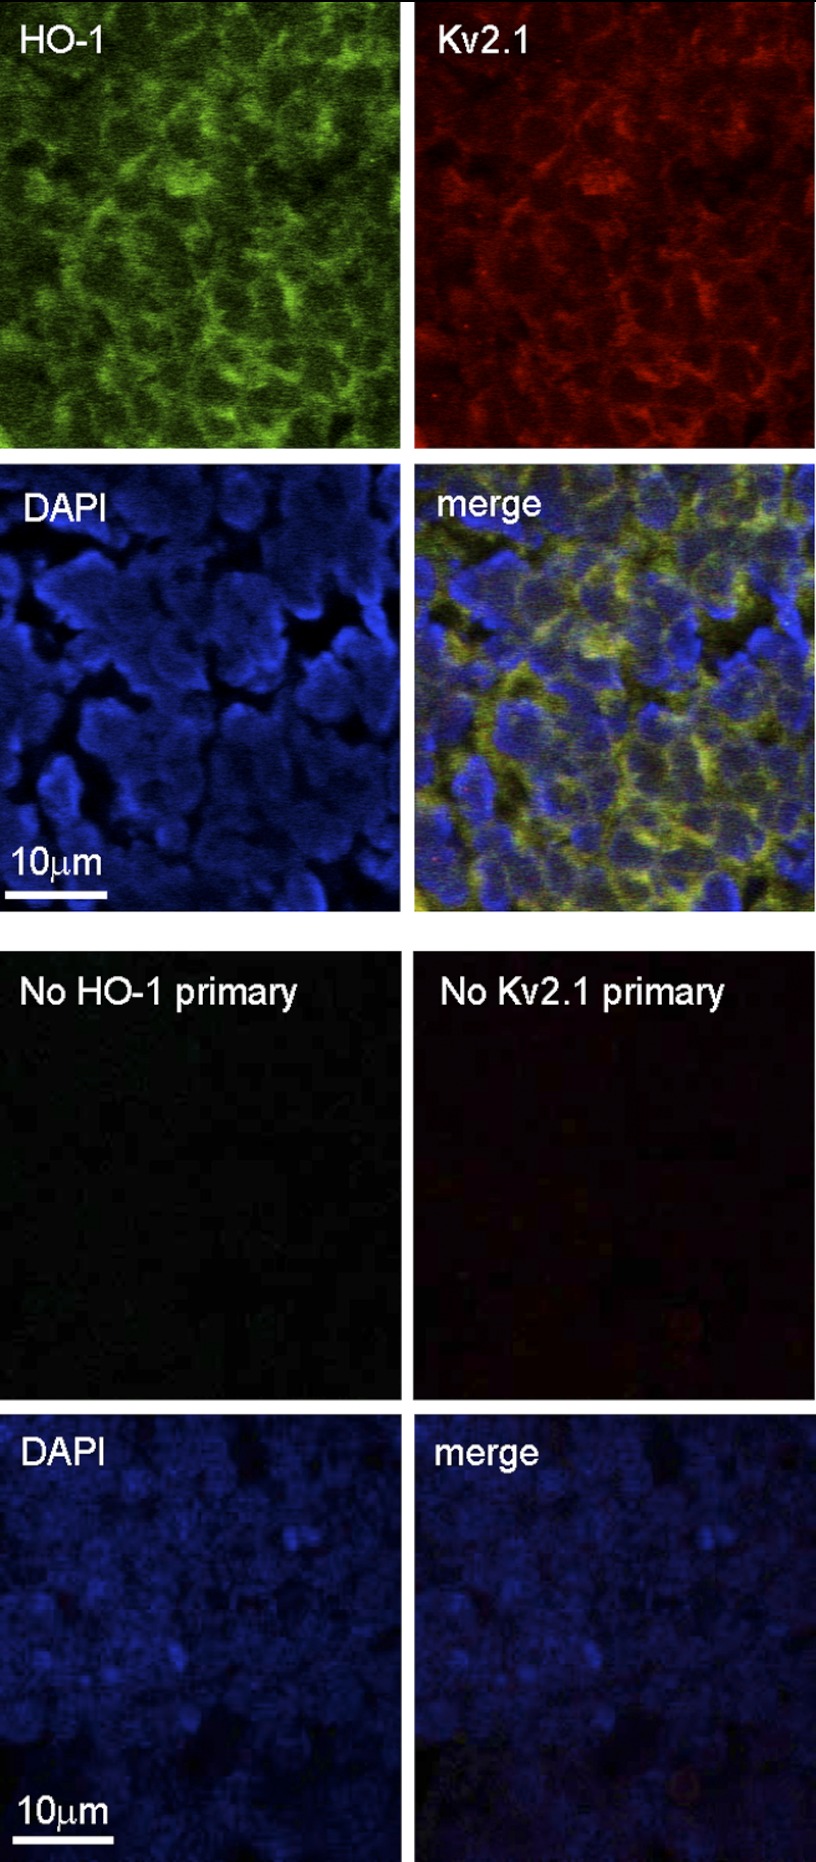
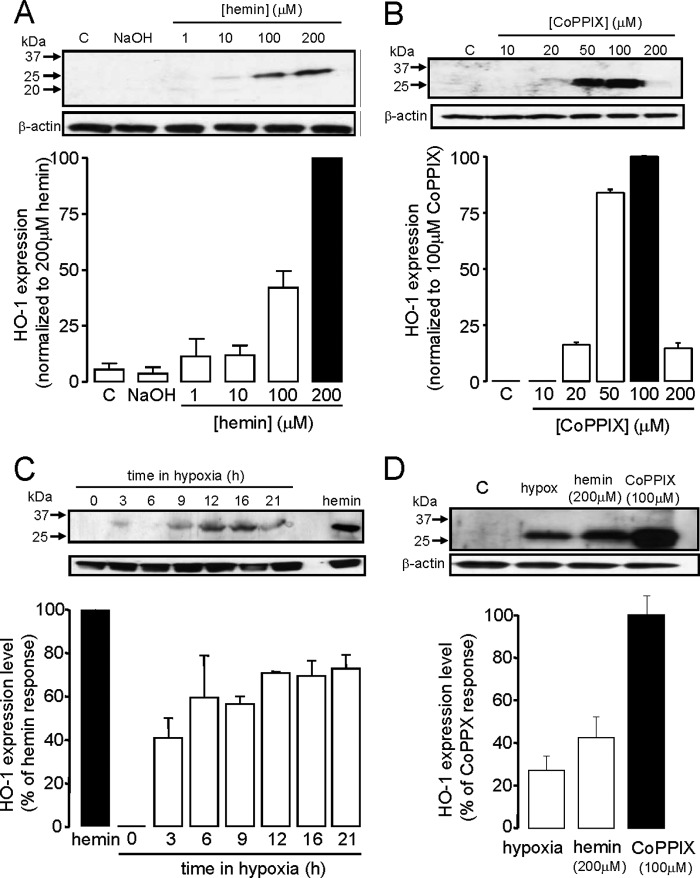
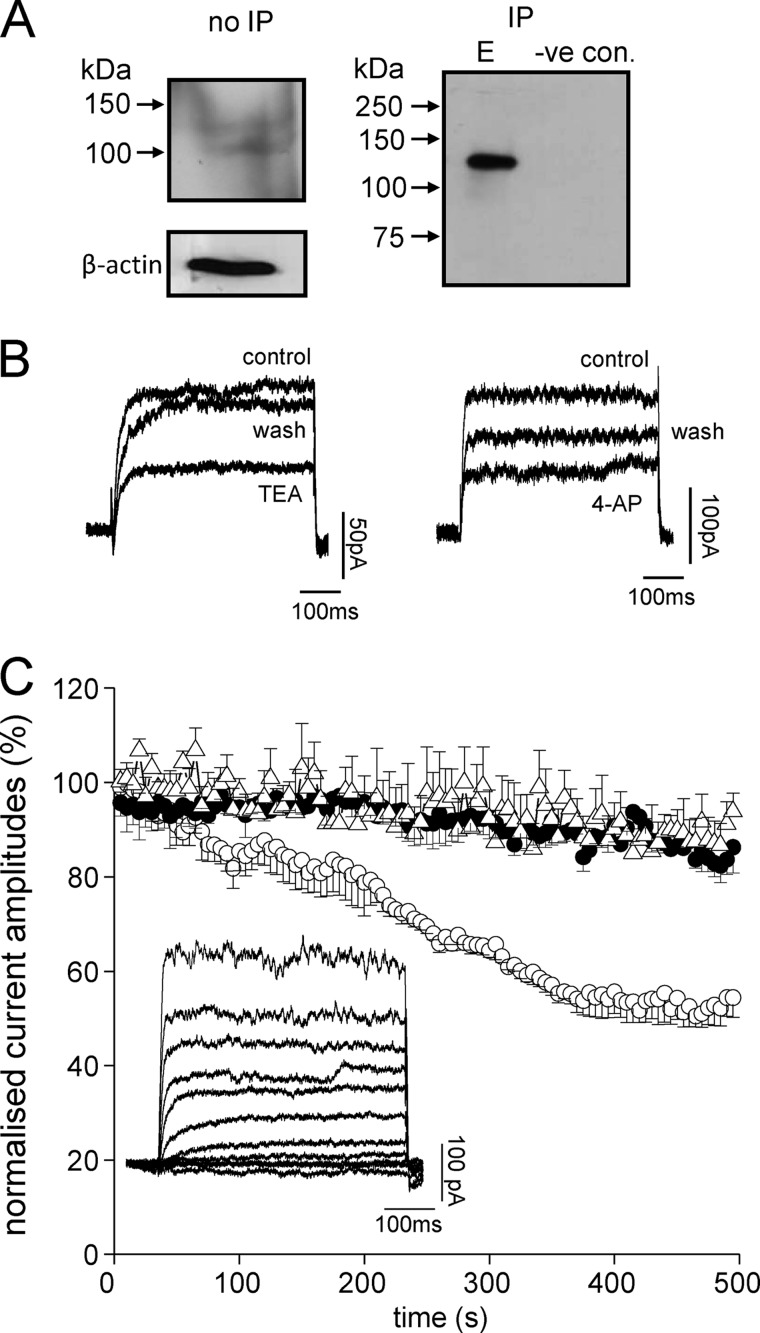
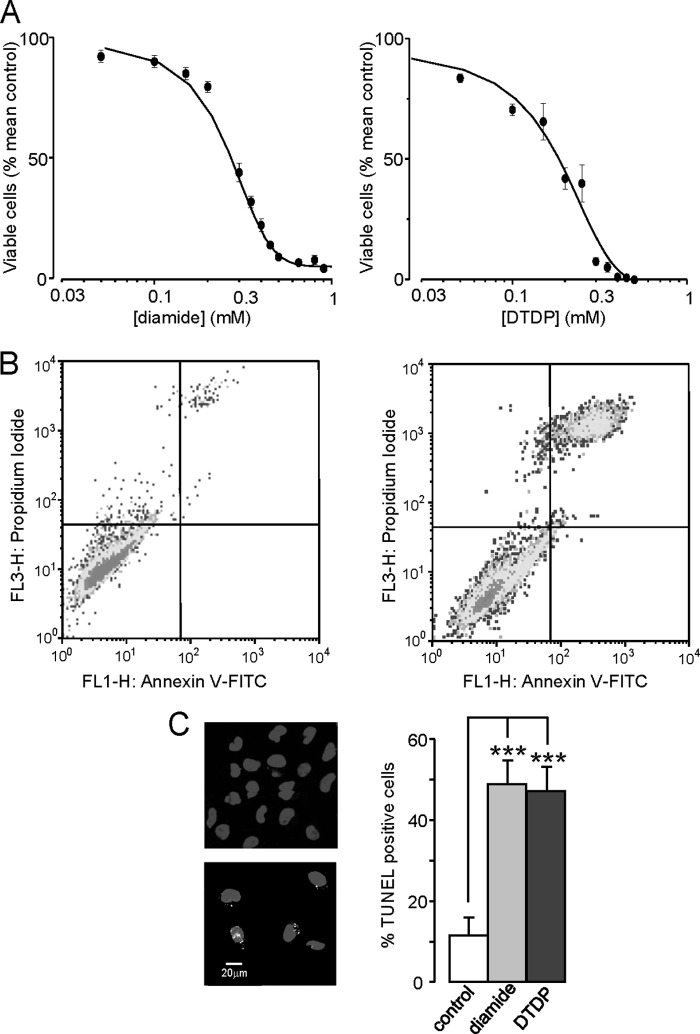
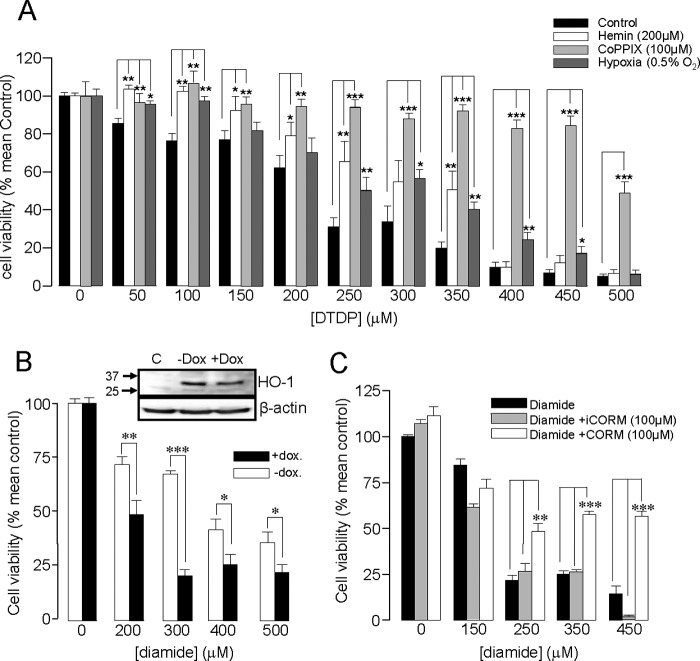
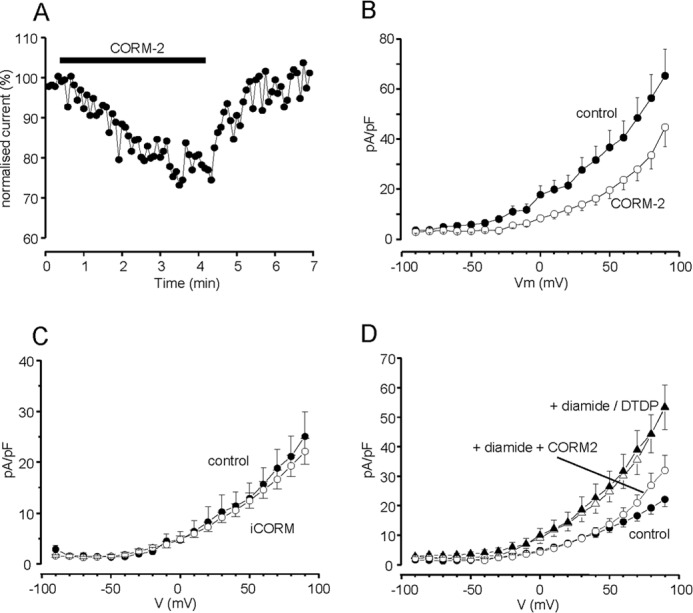
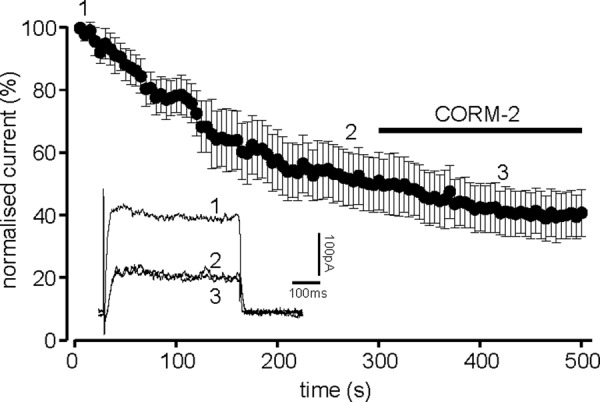
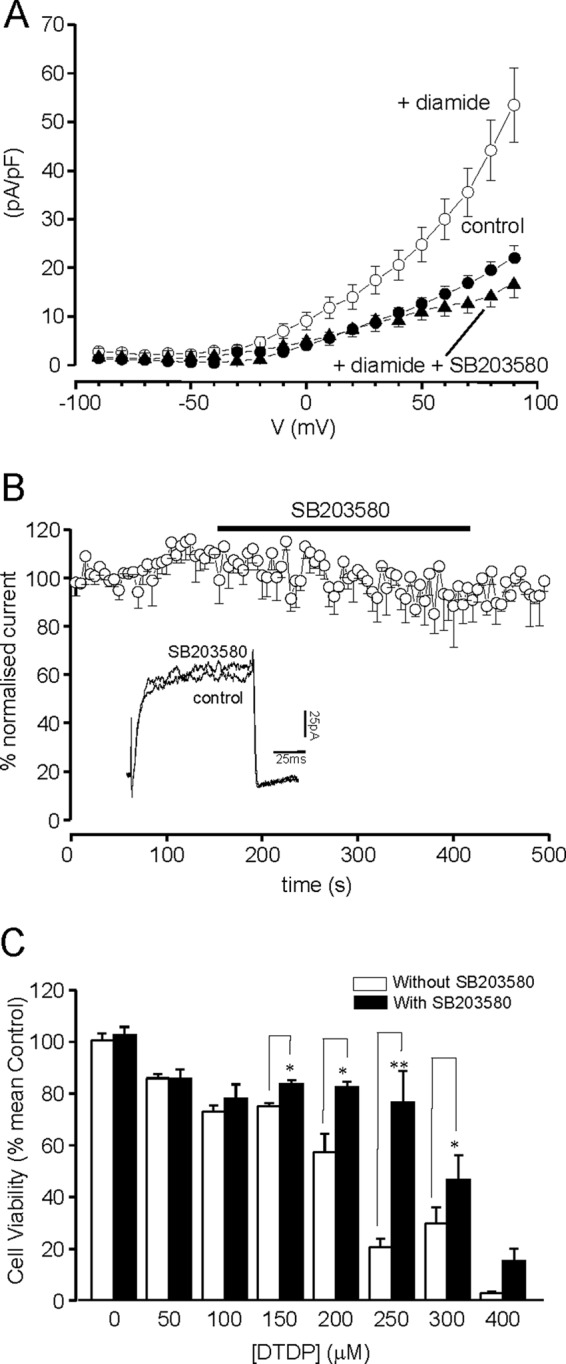
Tumor cell survival and proliferation is attributable in part to suppression of apoptotic pathways, yet the mechanisms by which cancer cells resist apoptosis are not fully understood. Many cancer cells constitutively express heme oxygenase-1 (HO-1), which catabolizes heme to generate biliverdin, Fe(2+), and carbon monoxide (CO). These breakdown products may play a role in the ability of cancer cells to suppress apoptotic signals. K(+) channels also play a crucial role in apoptosis, permitting K(+) efflux which is required to initiate caspase activation. Here, we demonstrate that HO-1 is constitutively expressed in human medulloblastoma tissue, and can be induced in the medulloblastoma cell line DAOY either chemically or by hypoxia. Induction of HO-1 markedly increases the resistance of DAOY cells to oxidant-induced apoptosis. This effect was mimicked by exogenous application of the heme degradation product CO. Furthermore we demonstrate the presence of the pro-apoptotic K(+) channel, Kv2.1, in both human medulloblastoma tissue and DAOY cells. CO inhibited the voltage-gated K(+) currents in DAOY cells, and largely reversed the oxidant-induced increase in K(+) channel activity. p38 MAPK inhibition prevented the oxidant-induced increase of K(+) channel activity in DAOY cells, and enhanced their resistance to apoptosis. Our findings suggest that CO-mediated inhibition of K(+) channels represents an important mechanism by which HO-1 can increase the resistance to apoptosis of medulloblastoma cells, and support the idea that HO-1 inhibition may enhance the effectiveness of current chemo- and radiotherapies.


Figures

FIGURE 1.
FIGURE 1.
Medulloblastoma tissue expresses HO-1 and Kv2.1. Immunohistological images of a section of human medulloblastoma tissue which had been formalin-fixed and embedded in paraffin wax. In the upper four panels the section was immunostained using primary antibodies against HO-1 (green, top left image), Kv2.1 (red, top right image), and stained with DAPI to highlight nuclei (blue, bottom left image). All images were merged to form the bottom right image, which indicates co-localization (yellow) of HO-1 and Kv2.1. In the lower four panels, images were taken from a separate section under identical filter conditions, but primary antibodies against HO-1 and Kv2.1 were omitted.
FIGURE 2.
FIGURE 2.
HO-1 induction in DAOY cells. A, example Western blot demonstrating induction of HO-1 expression (upper) following 24 h exposure to hemin at the concentrations indicated. C, control, NaOH, vehicle control. Below; bar graph showing relative mean induction (± S.E. bars, n = 3) from quantification of blots normalized to the induction produced by 200 μm hemin. B, as A, except HO-1 was induced by 24 h exposure to CoPPIX at the concentrations indicated. Below; bar graph showing relative mean induction (± S.E. bars, n = 3) from quantification of blots normalized to the induction produced by 100 μm CoPPIX. C, example Western blot showing induction of HO-1 following exposure of cells to hypoxia (0.5% O2) for the indicated periods of time. Also shown for comparison is the induction of HO-1 caused by 200 μm hemin. Below; bar graph showing relative mean induction (± S.E. bars, n = 3) caused by hypoxia from quantification of blots normalized to the induction produced by 200 μm hemin. D, example Western blot (upper) comparing HO-1 expression in DAOY cells in response to optimum levels of hypoxia, hemin, and CoPPIX used in subsequent functional studies. The bar graph plots the mean ± S.E. bars induction caused by hypoxia (16 h, n = 4), hemin (200 μm; n = 5), and CoPPIX (100 μm; n = 5) on HO-1 expression, normalized to the inductive effect of 100 μm CoPPIX. β-Actin loading controls are also shown for each panel.
FIGURE 3.
FIGURE 3.
DAOY cells express functional Kv2.1 channels. A, Western blots showing the presence of Kv2.1 channel protein in DAOY total cell lysate. The left-hand blot shows detection of Kv2.1 using an anti-Kv2.1 antibody in total DAOY cell lysate without immunoprecipitation (no IP); the right-hand blot is from lysate following immunoprecipitation with anti- Kv2.1 antibody (IP; E, elution). The lane labeled negative control was performed exactly as the IP but omitting the anti-Kv2.1 antibody. B, left: example voltage-gated K+ currents evoked in DAOY cells by step depolarizations to +50 mV before (control) during (TEA) and after (wash) exposure to 5 mm TEA. Right: example K+ currents evoked by step depolarizations to +50 mV before (control) during (4-AP) and after (wash) exposure to 10 mm 4-AP. C, normalized mean time courses (± S.E. bars) of K+ current amplitudes evoked by successive step depolarizations from −90 to +50 mV (100 ms). Cells were dialyzed with a pipette solution containing either no antibody (control, solid circles, n = 6 cells), an anti-Kv2.1 antibody (0.5 μg/ml, open circles, n = 6 cells) or an anti-Kv4.3 antibody (0.5 μg/ml, open triangles, n = 6 cells). Currents became significantly reduced (p < 0.05, unpaired t test) in the presence of anti-Kv2.1 antibody as compared with controls after 200 s dialysis. The inset shows an example of a family of currents evoked in response to voltage steps from −100 to +80 mV in 20 mV increments.
FIGURE 4.
FIGURE 4.
Oxidative stress induces apoptosis in DAOY cells. A, concentration-response relationships for the effects of diamide (left) and DTDP (right) on DAOY cells viability. Cells were treated for 10 min as described under “Experimental Procedures” and then assessed for viability using MTT assay. Each data point is the mean (± S.E. bars) taken from 3 measurements in each case. Data were fitted using Origin 7.5 software, yielding IC50 values of 256.8 ± 15.7 μm for diamide and 180.0 ± 28.2 μm for DTDP. B, flow cytometry analysis of DAOY cells under control conditions (left) and following oxidative stress (right; 100 μm DTDP for 10 min). Cells were stained with FITC-labeled annexin V and PI. Late apoptotic cells are located in the upper right quadrant of the two displays. C, TUNEL assay analysis of DAOY cells under control conditions (left, upper image) and during oxidative stress (200 μm diamide; lower image). Fluorescent images show DAPI-stained DAOY nuclei (blue) superimposed on specks of green, indicative of positive TUNEL staining for DNA fragmentation. Right: percentage of TUNEL-positive cells following treatment with DTDP (100 μm) or diamide (200 μm) versus untreated control cells (n = 10 fields of view for each coverslip; ***, p 0.001; 1-way ANOVA with Bonferroni multiple-comparison test).
FIGURE 5.
FIGURE 5.
HO-1 induction protects DAOY cells against oxidative stress. A, bar graph showing the mean (± S.E. bars) effect of oxidative stress (DTDP exposure, 0–500 μm) on DAOY cell viability. Cells were either untreated (control) or had HO-1 expression induced following incubation with hemin (200 μm, 24 h), CoPPIX (100 μm, 24 h), or hypoxia (0.5% O2, 16 h), as indicated. B, bar graph showing the mean effect on viability of diamide in DAOY cells stably expressing doxycycline-inducible HO-1 targeting shRNA. Cells were pre-exposed to hemin (200 μm, 48 h) with or without doxycycline (2 μg/ml), as indicated. The inset shows Western blot of HO-1 levels in control cells and in cells pre-exposed to hemin (200 μm, 48h) with or without doxycycline (2 μg/ml). C, bar graph showing the mean effect on viability of DAOY cells treated with diamide with and without the subsequent incubation of CORM-2 (100 μm, 3h) or iCORM (100 μm, 3 h). In A–C, each experiment was repeated three times in triplicate, and the mean number obtained each time was used for statistical analysis. (*, p < 0.05; **, p < 0.01, ***, p < 0.001; 2 way ANOVA with Bonferroni multiple-comparison test).
FIGURE 6.
FIGURE 6.
CO inhibits K+ currents and the oxidant-induced K+ current upsurge in DAOY cells. A, example time course of the reversible inhibitory effect of CORM-2. Currents were evoked by successive step depolarizations from −80 to +50 mV and CORM-2 (30 μm) was applied for the period indicated by the bar. Current amplitudes are normalized to those evoked by the first 10 depolarizations. B, mean (± S.E., n = 19 cells) current density versus voltage relationships in DAOY cells under control conditions (solid circles) and during exposure to CORM-2 (30 μm; open circles). CORM-2 caused significant reductions in current density (p < 0.05-p < 0.001, paired Student's t test) over the voltage range +10 to +90 mV. C, mean (± S.E., n = 10 cells) current density versus voltage relationships in DAOY cells under control conditions (solid circles) and during exposure to iCORM (30 μm; open circles). D, mean (± S.E.) current density versus voltage relationships determined in control cells (solid circles; n = 17), following exposure to 100 μm DTDP (solid triangles, n = 12) or 200 μm diamide (open triangles, n = 10) and following exposure to diamide in the presence of 30 μm CORM-2 (open circles, n = 8), as indicated. Effects of oxidants were significant (p < 0.05 - p < 0.01; unpaired t-tests), but diamide was without significant effect in the presence of CORM-2.
FIGURE 7.
FIGURE 7.
CO primarily inhibits Kv2.1 in DAOY cells. Normalized mean time course (± S.E. bars) of K+ current amplitudes evoked by successive step depolarizations from −90 to +50 mV (100 ms). Cells were dialyzed with a pipette solution containing an anti-Kv2.1 antibody (0.5 μg/ml, n = 6 cells). For the period indicated by the horizontal bar, the perfusate was switched for one containing 30 μm CORM-2. The inset shows example currents evoked in one of the dialyzed cells at the time points indicated by the numbers.
FIGURE 8.
FIGURE 8.
Inhibition of Kv2.1 phosphorylation with the selective inhibitor p38 MAPK inhibits the oxidant-induced upsurge of K+ current and protects DAOY cells against oxidative stress. A, mean (± S.E.) current density versus voltage relationships determined in control cells (solid circles, n = 10), following exposure to diamide (open circles; n = 10) and following exposure to diamide in the presence of p38 MAPK inhibitor (SB203580, 10 μm, closed triangles, n = 8), as indicated. Effects of SB203580 on the upsurge of K+ currents was significant (p < 0.05 to p < 0.001) over the voltage range +10 to +90 mV. B, normalized mean time course (± S.E. bars, n = 6) of K+ current amplitudes evoked by successive step depolarizations from −90 to +50 mV (100 ms). For the period indicated by the horizontal bar, the perfusate was switched for one containing 10 μm SB203580. C, bar graph showing the mean (± S.E. n = 3 experiments each performed in triplicate) cell viability under oxidative stress, with and without the p38 MAPK inhibitor (applied for 3 h). *, p < 0.05; **, p < 0.01; one way ANOVA with Bonferroni multiple-comparison test.

References

    1. Hanahan D., Weinberg R. A. (2011) Hallmarks of cancer: the next generation. Cell 144, 646–674 - PubMed
    1. Kelly G. L., Strasser A. (2011) The essential role of evasion from cell death in cancer. Adv. Cancer Res. 111, 39–96 - PMC - PubMed
    1. Hanahan D., Weinberg R. A. (2000) The hallmarks of cancer. Cell 100, 57–70 - PubMed
    1. Cory S., Adams J. M. (2002) The Bcl2 family: regulators of the cellular life-or-death switch. Nat. Rev. Cancer 2, 647–656 - PubMed
    1. Yu S. P., Canzoniero L. M., Choi D. W. (2001) Ion homeostasis and apoptosis. Curr. Opin. Cell Biol. 13, 405–411 - PubMed

Publication types

MeSH terms

LinkOut - more resources