. 2012 Jun 15;188(12):6319-27.
doi: 10.4049/jimmunol.1200467. Epub 2012 May 16.

Enhanced anti-serpin antibody activity inhibits autoimmune inflammation in type 1 diabetes

Affiliations

Enhanced anti-serpin antibody activity inhibits autoimmune inflammation in type 1 diabetes

Jan Czyzyk et al. J Immunol. .

Abstract

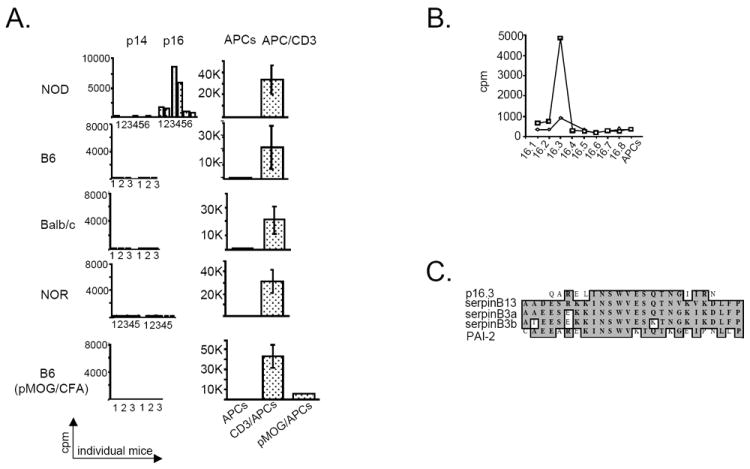
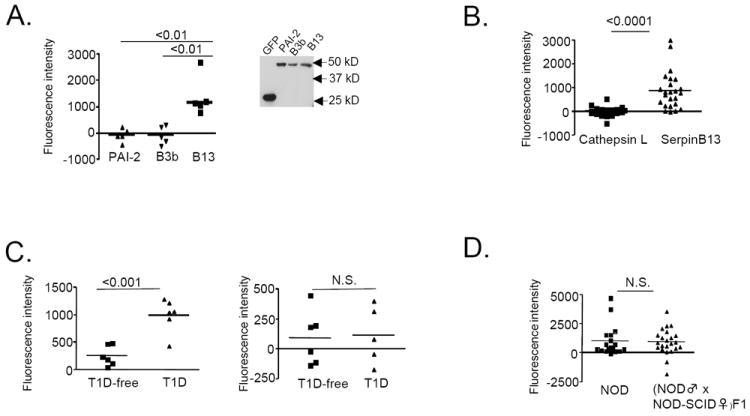
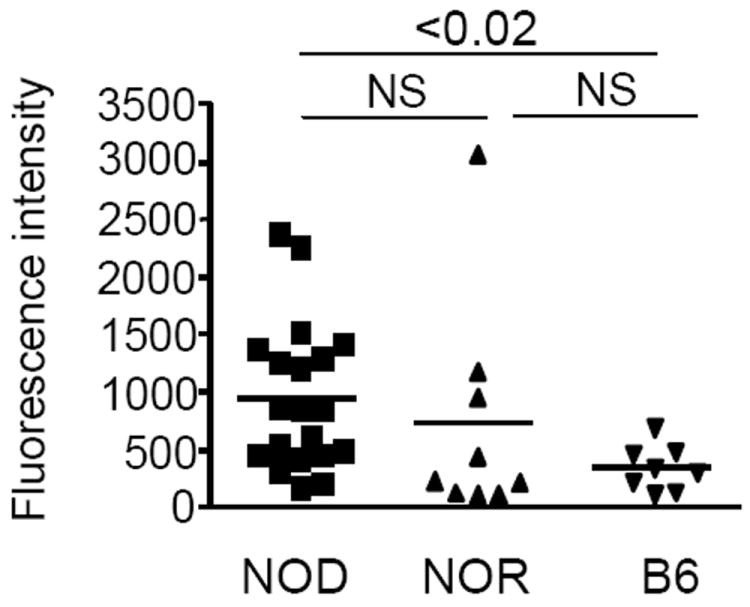
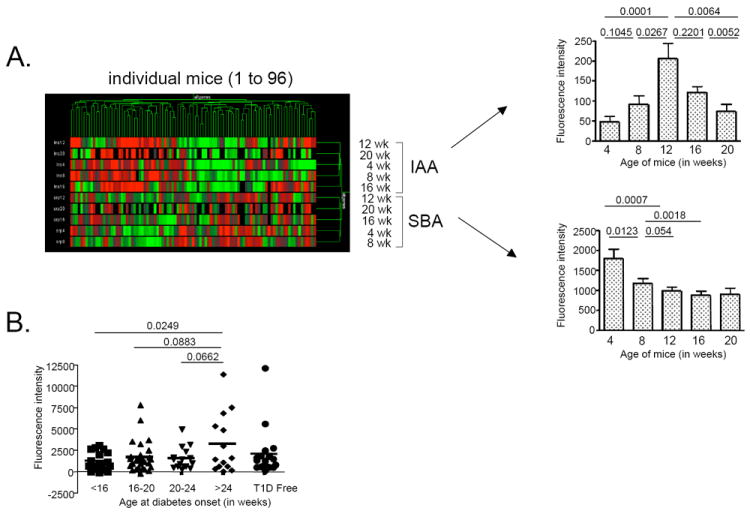
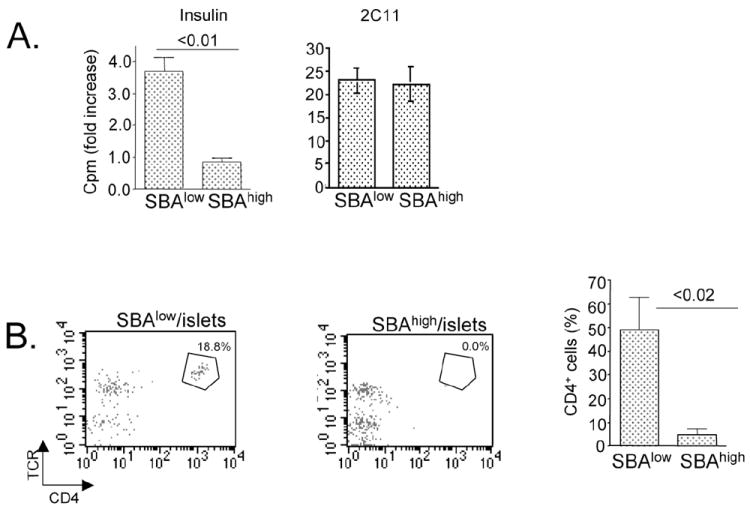
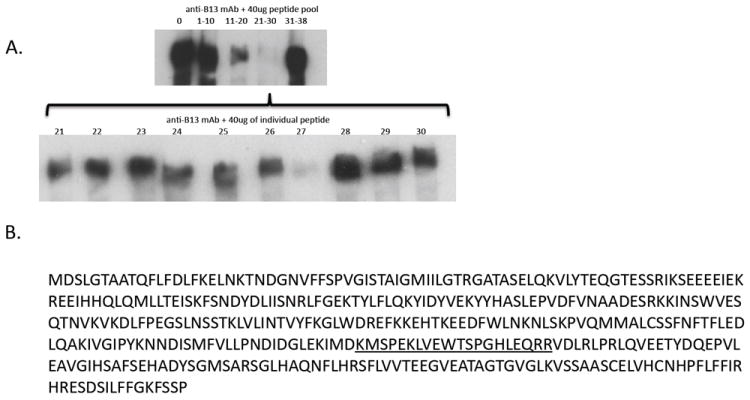
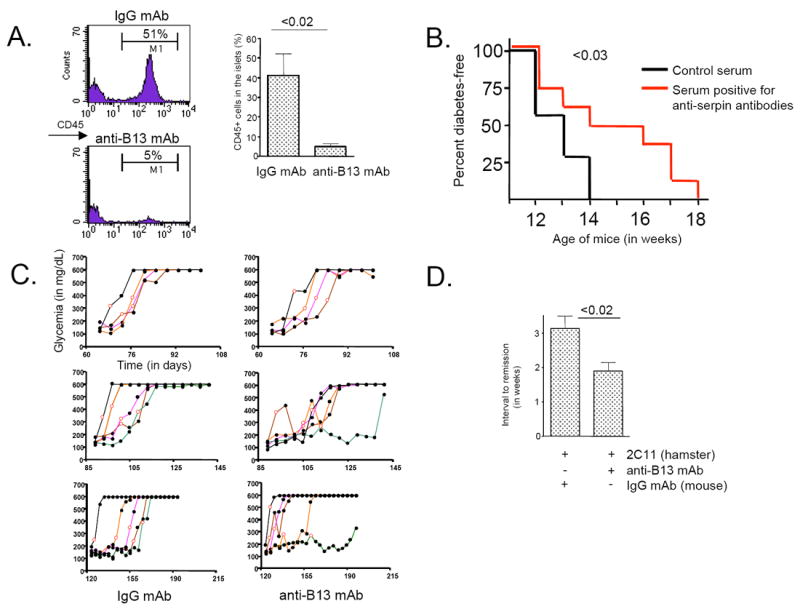
Intracellular (clade B) OVA-serpin protease inhibitors play an important role in tissue homeostasis by protecting cells from death in response to hypo-osmotic stress, heat shock, and other stimuli. It is not known whether these serpins influence immunological tolerance and the risk for autoimmune diseases. We found that a fraction of young autoimmune diabetes-prone NOD mice had elevated levels of autoantibodies against a member of clade B family known as serpinB13. High levels of anti-serpinB13 Abs were accompanied by low levels of anti-insulin autoantibodies, reduced numbers of islet-associated T cells, and delayed onset of diabetes. Exposure to anti-serpinB13 mAb alone also decreased islet inflammation, and coadministration of this reagent and a suboptimal dose of anti-CD3 mAb accelerated recovery from diabetes. In a fashion similar to that discovered in the NOD model, a deficiency in humoral activity against serpinB13 was associated with early onset of human type 1 diabetes. These findings suggest that, in addition to limiting exposure to proteases within the cell, clade B serpins help to maintain homeostasis by inducing protective humoral immunity.


Figures

Figure 1
Figure 1. Early immune response to clade B serpins precedes the clinical onset of autoimmune diabetes
(A) CD4+ T-cell proliferation in response to OVA peptides (pool 16 [p16]) and control cytochrome c peptides (p14) in various mouse strains. Splenic CD4+ T cells isolated from NOD (n=6), B6 (n=3), Balb/c (n=3), NOR (n=5), and B6 mice immunized with pMOG (n=3), were stimulated 3 times at 2-week intervals with either p14 or p16 (left column). In addition, CD4+ T cells from each strain were stimulated once with APCs and with anti-CD3 mAb (right column). T cells from pMOG-exposed mice were also stimulated with APCs and pMOG. (B) CD4+ T-cell proliferation in response to individual p16 peptides. The cells isolated from 8-week-old NOD mice (n=2) were stimulated with 10 μg/mL of individual p16 peptides (p16.1 - p16.8). Cpm, counts per minute. (C) Blast alignment of AA sequences in p16.3 and several clade B serpins.
Figure 2
Figure 2. The specificity of assay detecting anti-serpinB13 autoantibodies
Serum binding activity to serpinB13 was measured in the sera of NOD mice that were considered as negative (A, [n = 13]), weakly positive (B, [n = 14]) or positive (C, [n-15]) for anti-serpinB13 autoantibodies. Each sample was divided and preincubated at 4°C overnight with BSA (left) or with serpinB13 (right) at 1.0 μg/mL.
Figure 3
Figure 3. Immune response to clade B serpins in T1D is confined to serpinB13
(A) Serum binding activity for serpin PAI-2 (n=5), serpinB3b (n=5) and serpinB13 (n=5) in NOD mice. Data are expressed as fluorescent intensity (FI) units and represent the total FI minus the FI due to serum binding activity in the presence of beads precoated with a control lysate (293 T cells transfected with GFP). Insert: Western blot analysis of cell lysates expressing individual proteins and used to coat the beads. (B) Serum-binding activity for cathepsin L and serpinB13 in NOD mice. A mixture of 3 sets of fluorescent beads precoated with cell lysates expressing cathepsin L, serpinb13, or GFP (control) was incubated with serum samples from 4-to 5-week-old NOD mice. (C) Serum binding to serpinB13 (left) and secretagogin (right) in 12-week-old NOD SCID mice at 6 weeks after receiving an adoptive transfer of splenocytes (5 × 10⁶ cells/mouse) isolated from normal (T1D-free, n=6) or diabetic (T1D) NOD mice (n=6). (D) Serum-binding activity for serpinB13 in the offspring of wild type and immunodeficient NOD mice. Blood samples were obtained for testing from all mice at 4.5 weeks of age. The number of animals examined was 19 (wild type) and 23 (immunodeficient). Serum binding assay and verification of protein expression (data not shown) in B, C, and D was performed exactly as described in A. Data are from one experiment and are representative of at least two independent experiments.
Figure 4
Figure 4. Immune response to serpinB13 in various mouse strains
Serum-binding activity of serpinB13 in NOD (n = 20), NOR (n = 9), and B6 (n = 8) mice (A). The assay was performed exactly as described in Figure 3. Generalized estimating equations were used to model the relationship of antibody secretion among the three groups indicated. The overall chi-square test was significant (p=0.0354) as was the post-hoc comparison of NOD vs. B6 (p=0.0001).
Figure 5
Figure 5. Immunological response to serpinB13 is associated with prevention of early-onset autoimmune diabetes
(A) Left: Hierarchical clustering of anti-insulin autoantibody (IAA; 5 upper rows) and anti-serpinB13 autoantibody (SBA; 5 lower rows) in a cohort of NOD mice (n=96) from whom blood samples were taken at age 4 weeks then every 4 weeks thereafter until the onset of diabetes. Both antibodies were measured using Luminex technology. Right: The kinetics of IAA and SBA responses based on the data displayed in left panel. Generalized estimating equations were used to model the response variable in association with the relationship of antibody type and mouse age, using the robust sandwich estimator to accommodate correlations introduced by the longitudinal data. Pairwise comparisons of interest were carried out as indicated. (B) Distribution of anti-serpinB13 serum binding activity in 4-week-old NOD mice (n=96) by age of disease onset. Generalized estimating equations were used to model the relationship of antibody response and age at diabetes onset.
Figure 6
Figure 6. Immunological response to serpinB13 is associated with diminished diabetogenic response
(A) T-cell proliferation in NOD mice with high (SBAhigh, n=4) and low (SBAlow, n=4) levels of anti-serpinB13 autoantibodies. T cells were isolated from the pancreatic lymph nodes of 5-week-old NOD mice and stimulated with insulin (10 μg/mL) or 2C11 mAb (1.0 μg/mL) in the presence of APCs (T-cell depleted splenocytes). Proliferation was measured using a thymidine incorporation assay. Data are expressed as fold induction over stimulation with APCs alone. Error bars indicate standard deviation for assay performed in triplicate. (B) Analysis of CD4+ T cells in the pancreatic islets of 5-week-old NOD mice that were negative or positive for anti-serpin autoantibodies. The cell suspensions were obtained by exposing pancreatic islets to cellstripper buffer. The cells were stained with anti-CD4 and anti-TCR mAbs and analyzed by FACS. Right: The average of 4 independent experiments is shown.
Figure 7
Figure 7. Epitope mapping of anti-serpinB13 mAb
(A) Western blot analysis of serpinB13 staining with a mAb raised against this protein and preincubated with sequential pools of peptides (upper) or individual peptides (lower) corresponding to serpinB13. A 40 μg pool of peptides or individual peptides were incubated with anti-serpinB13 mAb in a volume of 100 μL at 4°C overnight and used for staining. (B) Full AA sequence of serpinB13. The sequence corresponding to peptide 27, which blocks staining with anti-serpinB13 mAb, is underlined.
Figure 8
Figure 8. Protective properties of the anti-serpinB13 mAb antibody
(A) FACS analysis of CD45+ cells (stained with 30-F11 mAb) in islets from mice treated with anti-serpinB13 mAb. Four-week-old female NOD mice received 4 injections of mAb (n=4) or the IgG mAb control (n=4) (100 μg/injection) over 10 days. The animals were sacrificed at 5-to-6 weeks of age. Right: The average of 3 independent experiments is shown. (B) Diabetes-free survival in NOD mice treated with serum containing anti-serpinB13 autoantibodies. The recipient mice were prescreened for low anti-serpinB13 autoantibody levels and were injected every 3 days with a 100-μL sample of serum containing either a high (n=7) or low (n=7) levels of anti-serpin autoantibodies. A total of 10 injections were made, the first at 3.5 weeks of age. After the last injection, the animals were followed weekly for evidence of glucosuria. (C) Blood glucose levels in NOD mice following treatment with anti-serpinB13 mAb. Animals were injected 4 times with anti-serpinB13 mAb (right) or IgG mAb control (left) (100 μg/injection) starting on the day of diagnosis (open circles), and their glucose levels were measured every 5 days thereafter. Data are displayed according to age at onset of diabetes: early (<12 weeks [upper]), intermediate (12-16 weeks [middle]) and late (>16 weeks [upper]) onset. The trajectory of each mouse towards the development of disease is shown in a different color. In groups treated with anti-serpinB13 mAb, responders are depicted in green, orange and brown and nonresponders are shown in black and purple. To determine the difference between control and treatment groups that develop diabetes after 12 weeks, animals from intermediate- and late-onset groups were combined. The Fisher’s exact test was used for the statistical analysis. (D) Timing of recovery from diabetes. Animals were treated with 2C11 mAb (10 μg/injection) and IgG mAb control (n=10) or 2C11 and anti-serpinB13 mAb (n=14). This injection regimen was similar to that described in C. The data are from one experiment and are representative of two to three independent experiments.

Similar articles

Cited by

References

    1. Anderson MS, Bluestone JA. The NOD mouse: a model of immune dysregulation. Ann Rev Immunol. 2005;23:447–485. - PubMed
    1. Solomon M, Sarvetnick N. The pathogenesis of diabetes in the NOD mouse. Adv Immunol. 2004;84:239–264. - PubMed
    1. Martin S, Wolf-Eichbaum D, Duinkerken G, Scherbaum WA, Kolb H, Noordzji JG, Roep BO. Development of type 1 diabetes despite severe hereditary B-lymphocyte deficiency. N Eng J Med. 2001;345:1036–1040. - PubMed
    1. Harjutsalo V, Sjoberg L, Tuomilehto J. Time trends in the incidence of type 1 diabetes in Finnish children: a cohort study. Lancet. 2008;371:1777–1782. - PubMed
    1. Patterson CC, Dahlquist GG, Gyurus A, Green A, Soltesz H EURODIAB Study Group. Incidence trends for childhood type 1 diabetes in Europe during 1989-2003 and predicted new cases 2005-2020: a multicentre prospective registration study. Lancet. 2009;373:2027–2033. - PubMed

Publication types