

Genome-wide recruitment to Polycomb-modified chromatin and activity regulation of the synovial sarcoma oncogene SYT-SSX2
- PMID: 22594313
- PMCID: PMC3460777
- DOI: 10.1186/1471-2164-13-189
Genome-wide recruitment to Polycomb-modified chromatin and activity regulation of the synovial sarcoma oncogene SYT-SSX2
Abstract
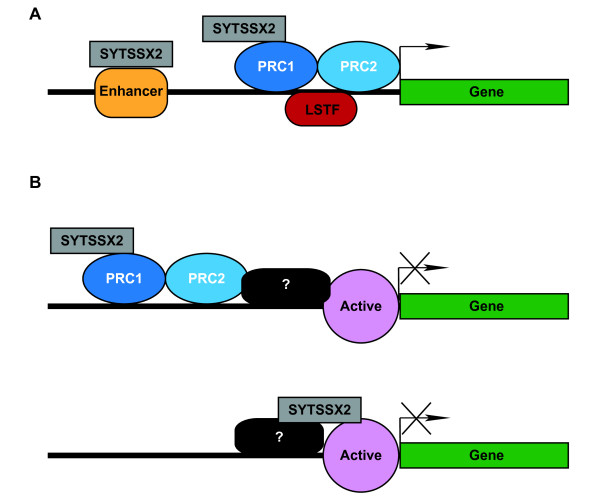
Background: SYT-SSX is the oncogene associated with synovial sarcoma (SS), a stem cell disease. SYT-SSX is thought to be responsible for sarcoma initiation and development. It interacts with components of Polycomb and SWI/SNF complexes, the two epigenetic controllers that maintain the heritable status of differentiation-specific genes in the stem/progenitor cell. Through these associations SYT-SSX is thought to alter gene expression programs by epigenetic mechanisms. Recently, we reported that SYT-SSX2 reprograms mesenchymal stem cells and myoblasts by dictating their commitment to the neural lineage while disrupting their normal differentiation. This reprogramming was due to the direct occupancy of proneural genes by the SYT-SSX2 nuclear complex. To gain a clear understanding of SYT-SSX2 control of gene expression networks, we conducted a thorough genome-wide analysis to determine the mechanism of its recruitment and identify signature sets of epigenetic markers that would predict its targeting and transcriptional activity.
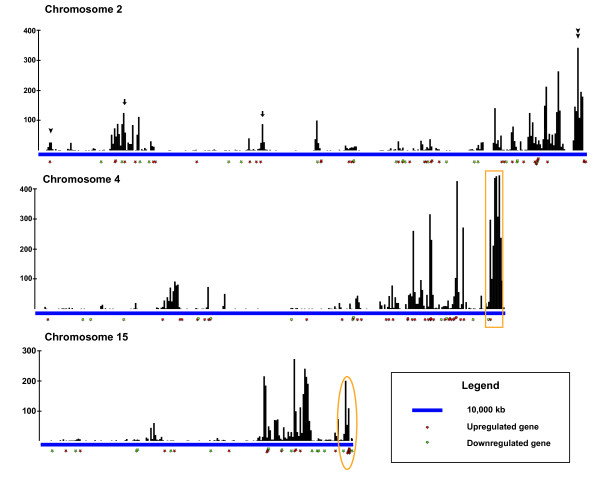
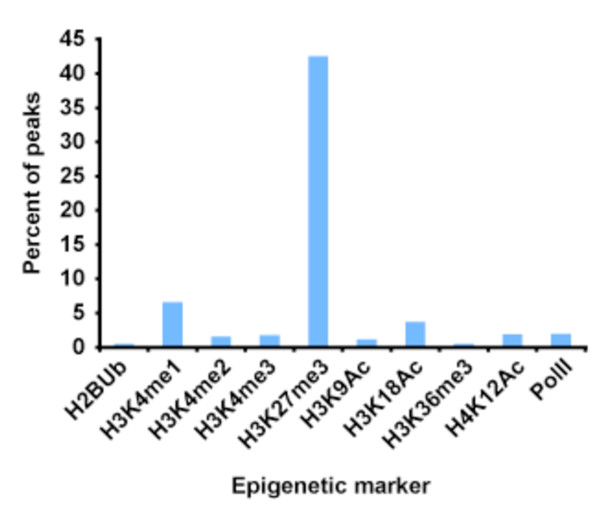
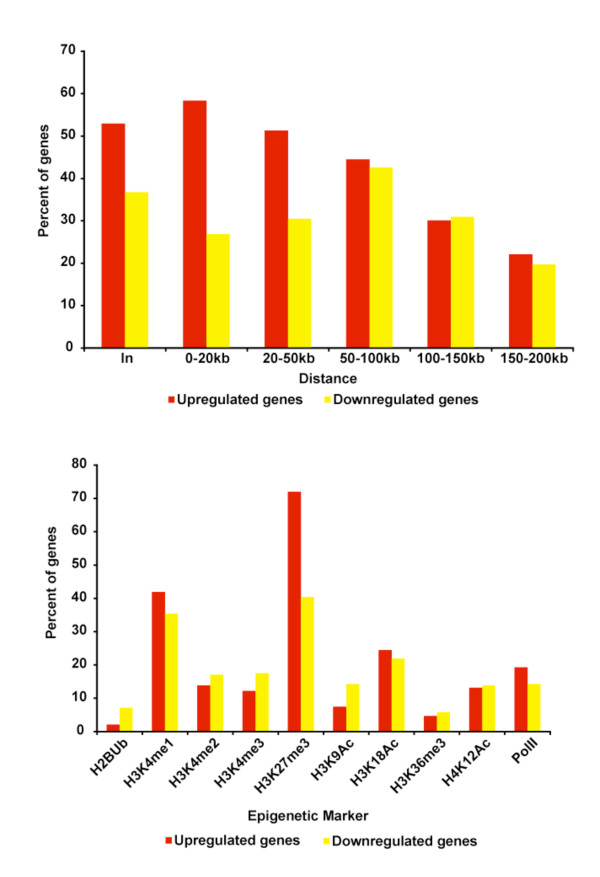
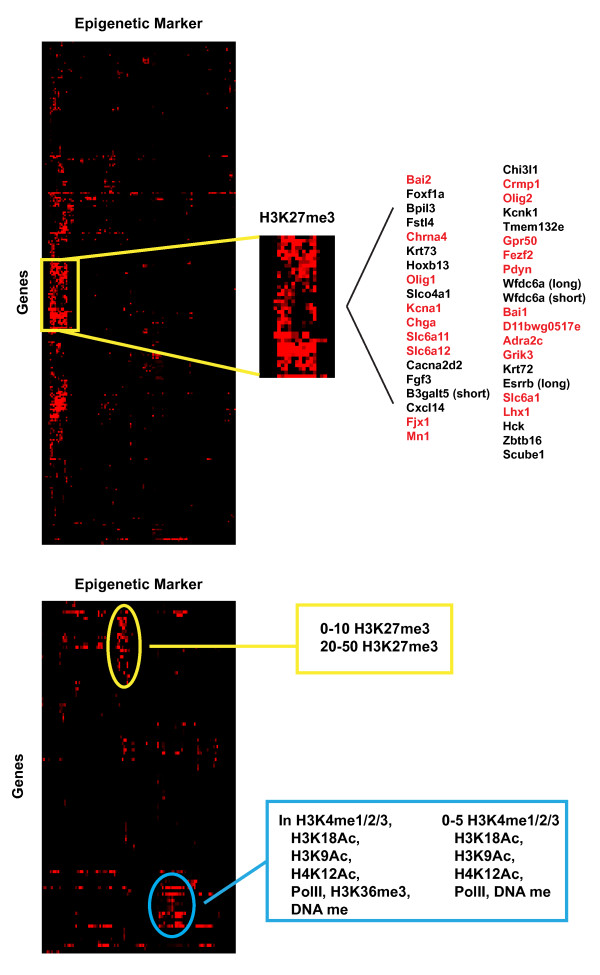
Results: SYT-SSX2 was recruited to distinct loci across all chromosomes, and an overwhelming number of Polycomb-modified sites enriched with the trimethylated histone H3 on lysine 27 (H3K27me3) formed the main recruiting module for SYT-SSX2. Not all SYT-SSX2/H3K27me3-occupied genes had altered expression, denoting the requirement for additional signals upon oncogene binding. Differential binding and epigenetic patterns distinguished upregulated and downregulated genes. Most activated genes had SYT-SSX2 sites enriched with H3K27me3 within their body or near their transcription start site (TSS) whereas a majority of downregulated genes were characterized by SYT-SSX2/H3K27me3-rich regions at long-range, or by modifications associated with transcription activation within the gene body or near the TSS. Hierarchical and functional clustering identified H3K27me3 as the dominant epigenetic marker associated with SYT-SSX2 binding and gene expression. Notably, this analysis revealed a cluster of upregulated neuronal genes densely covered by H3K27me3, consistent with programming toward the neural lineage by SYT-SSX2 observed previously.
Conclusions: The data analysis revealed that Polycomb complexes or their modified chromatin and their stably silenced differentiation programs seem to be the main target for SYT-SSX2, suggesting that their perturbation is at the center of tumorigenesis driven by the oncogene. Further research into this mechanism is crucial to the full understanding of SS biology.
Figures
Similar articles
-
Reprogramming of mesenchymal stem cells by the synovial sarcoma-associated oncogene SYT-SSX2.Oncogene. 2012 May 3;31(18):2323-34. doi: 10.1038/onc.2011.418. Epub 2011 Sep 26. Oncogene. 2012. PMID: 21996728 Free PMC article.
-
The synovial sarcoma-associated SYT-SSX2 oncogene antagonizes the polycomb complex protein Bmi1.PLoS One. 2009;4(4):e5060. doi: 10.1371/journal.pone.0005060. Epub 2009 Apr 1. PLoS One. 2009. PMID: 19337376 Free PMC article.
-
The synovial-sarcoma-associated SS18-SSX2 fusion protein induces epigenetic gene (de)regulation.Cancer Res. 2006 Oct 1;66(19):9474-82. doi: 10.1158/0008-5472.CAN-05-3726. Cancer Res. 2006. PMID: 17018603
-
Fusions of the SYT and SSX genes in synovial sarcoma.Oncogene. 2001 Sep 10;20(40):5755-62. doi: 10.1038/sj.onc.1204601. Oncogene. 2001. PMID: 11607825 Review.
-
SYT-SSX fusion genes in synovial sarcoma of the thorax.Lung Cancer. 2004 Jun;44(3):391-7. doi: 10.1016/j.lungcan.2003.11.011. Lung Cancer. 2004. PMID: 15140553 Review.
Cited by
-
Synovial sarcoma: recent discoveries as a roadmap to new avenues for therapy.Cancer Discov. 2015 Feb;5(2):124-34. doi: 10.1158/2159-8290.CD-14-1246. Epub 2015 Jan 22. Cancer Discov. 2015. PMID: 25614489 Free PMC article. Review.
-
The Biology of Synovial Sarcoma: State-of-the-Art and Future Perspectives.Curr Treat Options Oncol. 2021 Oct 23;22(12):109. doi: 10.1007/s11864-021-00914-4. Curr Treat Options Oncol. 2021. PMID: 34687366 Free PMC article. Review.
-
Loss of H3K27 tri-methylation is a diagnostic marker for malignant peripheral nerve sheath tumors and an indicator for an inferior survival.Mod Pathol. 2016 Jun;29(6):582-90. doi: 10.1038/modpathol.2016.45. Epub 2016 Mar 18. Mod Pathol. 2016. PMID: 26990975 Free PMC article.
-
Metastatic biomarkers in synovial sarcoma.Biomark Res. 2017 Feb 7;5:4. doi: 10.1186/s40364-017-0083-x. eCollection 2017. Biomark Res. 2017. PMID: 28191313 Free PMC article. Review.
-
BCOR Overexpression Is a Highly Sensitive Marker in Round Cell Sarcomas With BCOR Genetic Abnormalities.Am J Surg Pathol. 2016 Dec;40(12):1670-1678. doi: 10.1097/PAS.0000000000000697. Am J Surg Pathol. 2016. PMID: 27428733 Free PMC article.
References
-
- Naka N, Takenaka S, Araki N, Miwa T, Hasimoto N, Yoshioka K, Joyama S, Hamada KI, Tsukamoto Y, Tomita Y, Ueda T, Yoshikawa H, Itoh K. Synovial sarcoma is a stem cell malignancy. Stem Cells. 2010;28:1119–1131. - PubMed
Publication types
MeSH terms
Substances
Grants and funding
LinkOut - more resources
Full Text Sources
Molecular Biology Databases
