

Prefrontal cortical response to emotional faces in individuals with major depressive disorder in remission
- PMID: 22595508
- PMCID: PMC3995357
- DOI: 10.1016/j.pscychresns.2011.11.004
Prefrontal cortical response to emotional faces in individuals with major depressive disorder in remission
Abstract
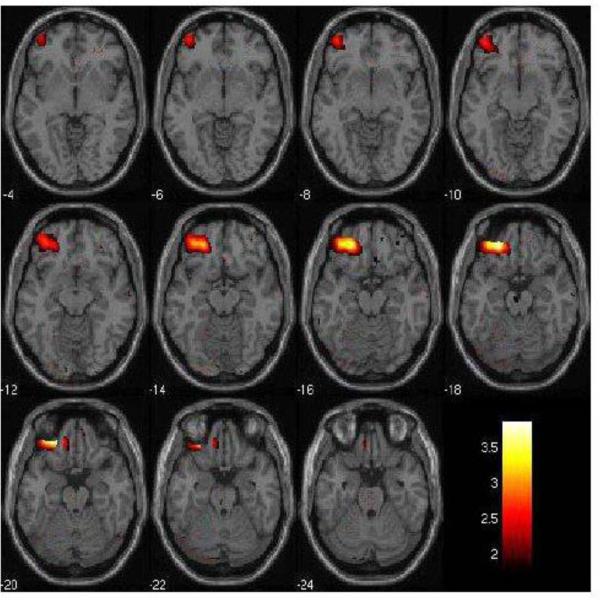
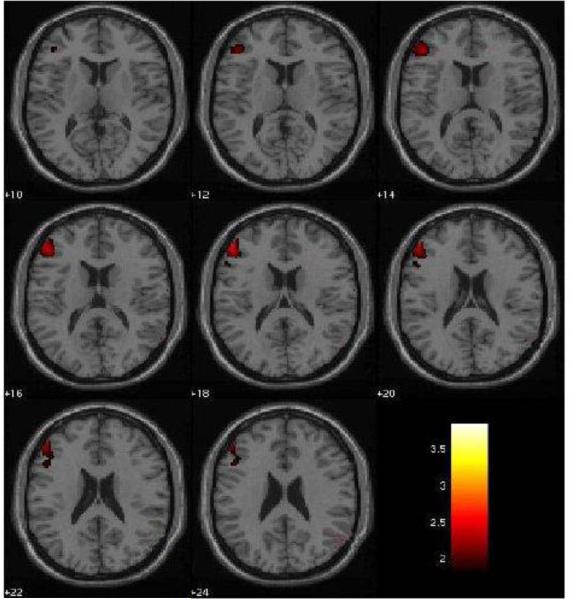
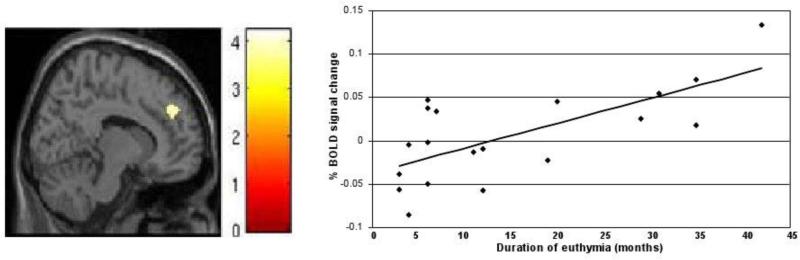
Abnormalities in the response of the orbitofrontal cortex (OFC) and dorsolateral prefrontal cortex (DLPFC) to negative emotional stimuli have been reported in acutely depressed patients. However, there is a paucity of studies conducted in unmedicated individuals with major depressive disorder in remission (rMDD) to assess whether these are trait abnormalities. To address this issue, 19 medication-free rMDD individuals and 20 healthy comparison (HC) participants were scanned using functional magnetic resonance imaging while performing an implicit emotion processing task in which they labeled the gender of faces depicting negative (fearful), positive (happy) and neutral facial expressions. The rMDD and HC groups were compared using a region-of-interest approach for two contrasts: fear vs. neutral and happy vs. neutral. Relative to HC, rMDD showed reduced activation in left OFC and DLPFC to fearful (vs. neutral) faces. Right DLPFC activation to fearful (vs. neutral) faces in the rMDD group showed a significant positive correlation with duration of euthymia. The findings support deficits in left OFC and DLPFC responses to negative emotional stimuli during euthymic periods of MDD, which may reflect trait markers of the illness or a 'scar' due to previous depression. Recovery may also be associated with compensatory increases in right DLPFC functioning.
Copyright © 2012 Elsevier Ireland Ltd. All rights reserved.
Figures
References
-
- Altshuler LL, Bookheimer SY, Townsend J, Proenza MA, Eisenberger N, Sabb F, Mintz J, Cohen MS. Blunted activation in orbitofrontal cortex during mania: a functional magnetic resonance imaging study. Biol Psychiatry. 2005;58:763–769. - PubMed
-
- Andreasen NC, Endicott J, Spitzer RL, Winokur G. The family history method using diagnostic criteria. Reliability and validity. Arch Gen Psychiatry. 1977;34:1229–1235. - PubMed
-
- Baxter LR, Jr., Schwartz JM, Phelps ME, Mazziotta JC, Guze BH, Selin CE, Gerner RH, Sumida RM. Reduction of prefrontal cortex glucose metabolism common to three types of depression. Archives of General Psychiatry. 1989;46:243–250. - PubMed
-
- Beck AT, Rush AJ, Shaw BF, Emery G. Cognitive therapy of depression. Guildford Press; New York: 1979.
-
- Bench CJ, Friston KJ, Brown RG, Frackowiak RS, Dolan RJ. Regional cerebral blood flow in depression measured by positron emission tomography: the relationship with clinical dimensions. Psychological Medicine. 1993;23:579–590. - PubMed
Publication types
MeSH terms
Grants and funding
- UL1 RR024139/RR/NCRR NIH HHS/United States
- UL1 TR000005/TR/NCATS NIH HHS/United States
- K01 MH086621/MH/NIMH NIH HHS/United States
- R37 MH043775/MH/NIMH NIH HHS/United States
- K23 MH077914/MH/NIMH NIH HHS/United States
- RC1 MH088366/MH/NIMH NIH HHS/United States
- R01 MH069747/MH/NIMH NIH HHS/United States
- R37 MH43775/MH/NIMH NIH HHS/United States
- R01 MH076971/MH/NIMH NIH HHS/United States
- K01 MH083001/MH/NIMH NIH HHS/United States
- R01 MH69747/MH/NIMH NIH HHS/United States
- R01 MH074797/MH/NIMH NIH HHS/United States
- K01MH086621/MH/NIMH NIH HHS/United States
- R01 MH077945/MH/NIMH NIH HHS/United States
- R01 MH070902/MH/NIMH NIH HHS/United States
LinkOut - more resources
Full Text Sources
