. 2012 May 15;22(5):1017-29.
doi: 10.1016/j.devcel.2012.02.013.

Kif18A and chromokinesins confine centromere movements via microtubule growth suppression and spatial control of kinetochore tension

Affiliations

Kif18A and chromokinesins confine centromere movements via microtubule growth suppression and spatial control of kinetochore tension

Jason Stumpff et al. Dev Cell. .

Abstract

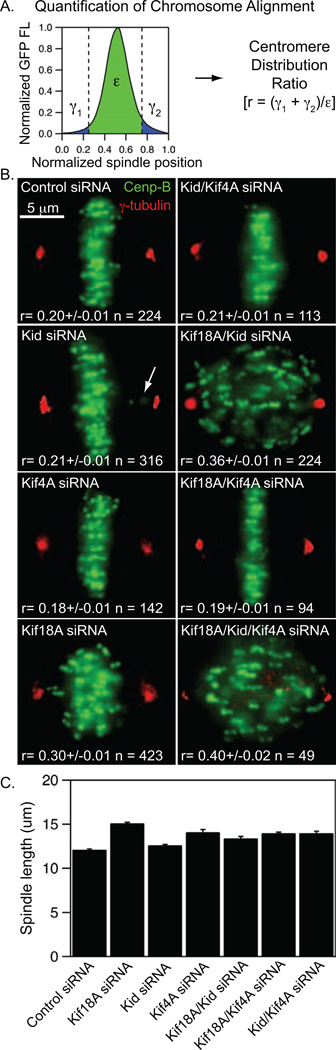
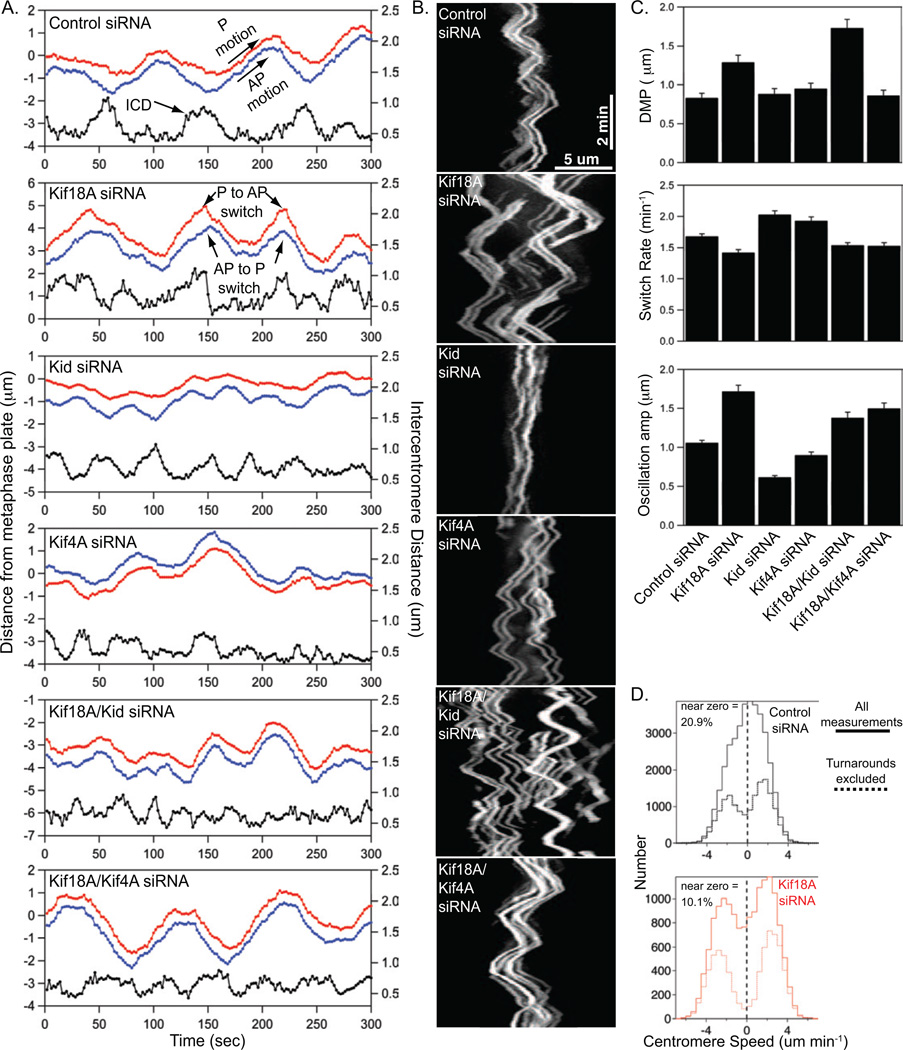
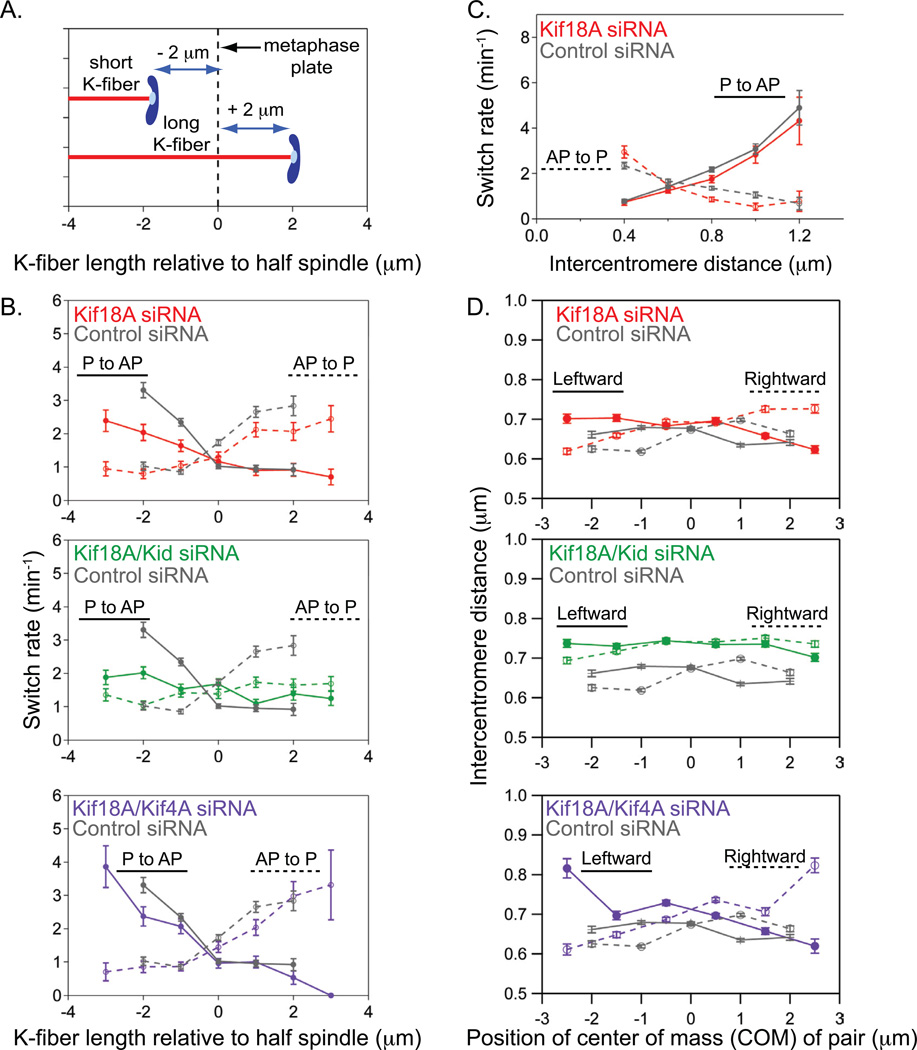
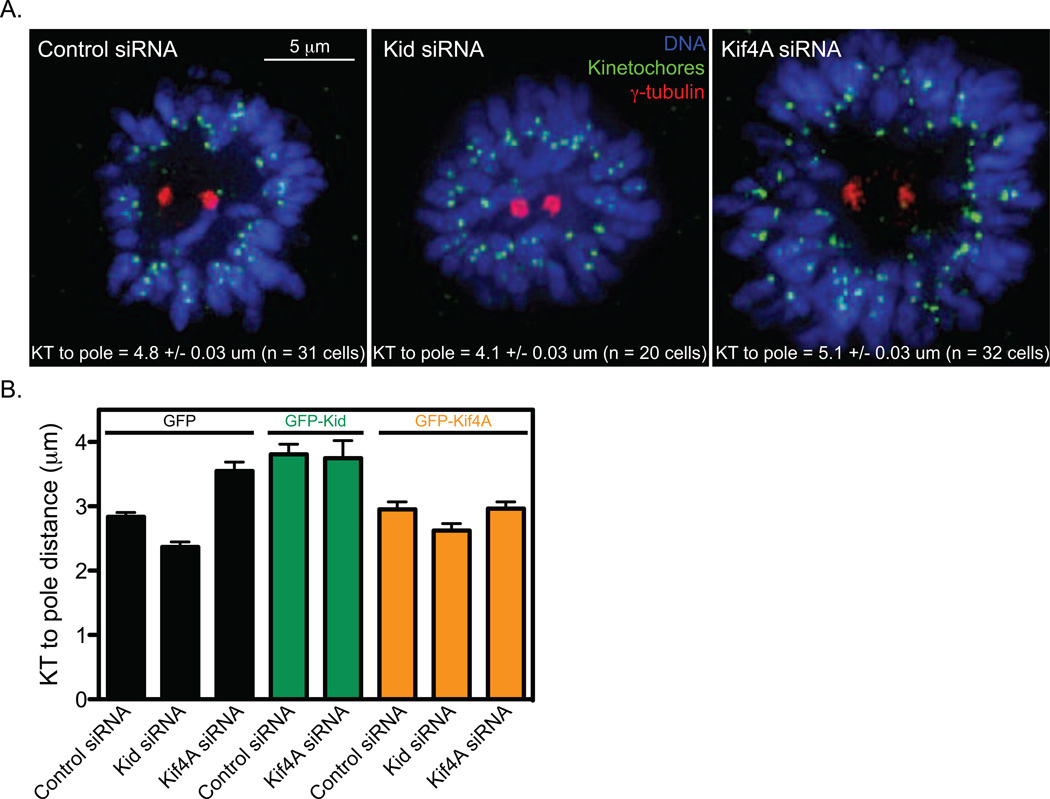
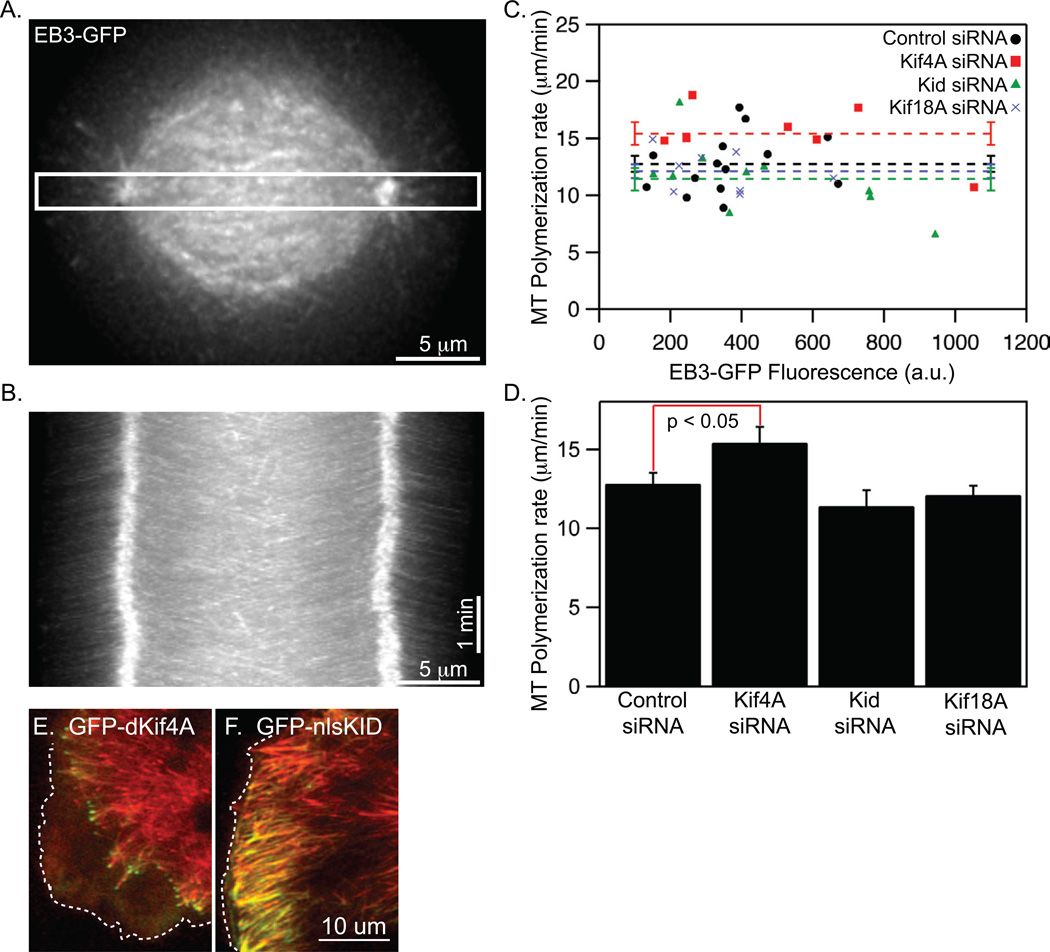
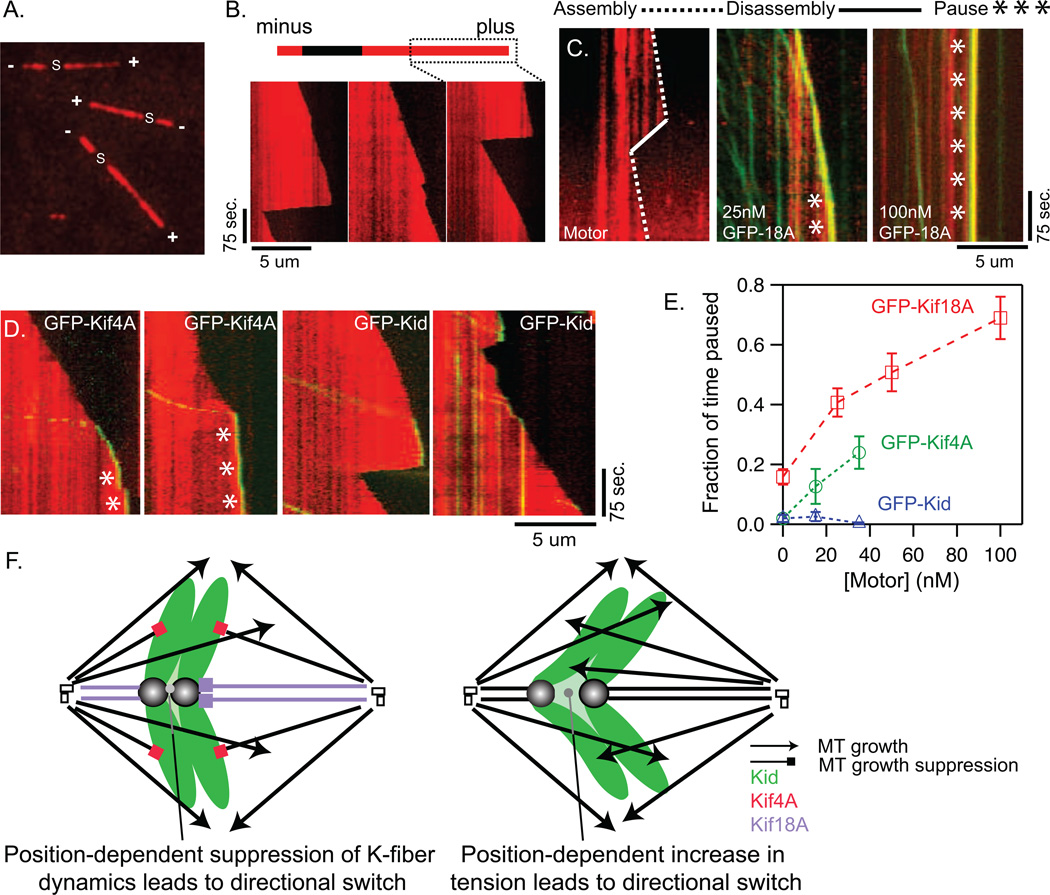
Alignment of chromosomes at the metaphase plate is a signature of cell division in metazoan cells, yet the mechanisms controlling this process remain ambiguous. Here we use a combination of quantitative live-cell imaging and reconstituted dynamic microtubule assays to investigate the molecular control of mitotic centromere movements. We establish that Kif18A (kinesin-8) attenuates centromere movement by directly promoting microtubule pausing in a concentration-dependent manner. This activity provides the dominant mechanism for restricting centromere movement to the spindle midzone. Furthermore, polar ejection forces spatially confine chromosomes via position-dependent regulation of kinetochore tension and centromere switch rates. We demonstrate that polar ejection forces are antagonistically modulated by chromokinesins. These pushing forces depend on Kid (kinesin-10) activity and are antagonized by Kif4A (kinesin-4), which functions to directly suppress microtubule growth. These data support a model in which Kif18A and polar ejection forces synergistically promote centromere alignment via spatial control of kinetochore-microtubule dynamics.


Figures

Figure 1
Figure 1
Kif18A and chromokinesins collectively regulate centromere alignment. (A) Method used to quantitatively analyze centromere alignment. The distribution of GFP fluorescence (FL) along the normalized pole-to-pole axis was measured in HeLa cells expressing EGFP-CENP-B (green) and stained for γ-tubulin (red). A centromere distribution ratio (r) was calculated for each cell using the indicated formula. (B) Representative images of cells treated with the indicated siRNAs. The mean ± SEM for centromere distribution ratios measured from the indicated number of mitotic cells (n) are reported for each cell type. p-values calculated from comparison to control siRNA cells are 4.9 × 10⁻²⁹ (Kif18A), 0.23 (Kid), 0.003 (Kif4A), 1.2 × 10⁻³⁵ (Kif18A/Kid), 0.14 (Kif18A/Kif4A), 0.46 (Kid/Kif4A) and 1.0 × 10⁻¹² (Kif18A/Kid/Kif4A). Arrow indicates an example of a centromere pair near the spindle pole in a Kid-depleted cell. (C) Plot of average spindle length in HeLa cells depleted of the indicated kinesins. Spindle lengths were measured as the distance between γ-tubulin labeled centrosomes in fixed cells. Error bars are SEM.
Figure 2
Figure 2
Kif18A and chromokinesins differentially impact mitotic centromere movements. (A) Plots of centromere movement as a function of time. The red and blue traces show the movements of a pair of sister centromeres. The black traces show changes in the distance between the red and blue centromeres, called intercentromere distance (ICD), over time. Examples of poleward (P) motion, away from pole (AP) motion, poleward-to-away from pole switches (P to AP) and away from pole-to-poleward switches are indicated with arrows. (B) Kymographs of EGFP-CENP-B movements in HeLa cells treated with siRNAs targeting the indicated kinesins. Horizontal scale bar is 5 µm, vertical scale bar is 2 minutes. (C) Plots of average distance from the metaphase plate (DMP), switch rates, and oscillation amplitudes for centromeres tracked in cells depleted of the indicated kinesins. Error bars indicate SEM. (D) Histograms of centromere speeds measured using a five point (10 second) sliding regression fit to plots of centromere movement. Negative values represent speeds during P movement, while positive values are speeds measured during AP movement. The solid lines display all speed measurements made from the data set described in Table 1, while the dashed lines represent the same data set with the exclusion of points that occured within 10-seconds of a directional switch. The percentage of near-zero speeds (between −0.5 and 0.5 µm/min) measured in control and Kif18A-depleted cells is reported for the unfiltered data set (solid lines).
Figure 3
Figure 3
Kid and Kif4A oppositely tune centromere switch rates and intercentromere distance as a function of position in the absence of Kif18A activity. (A) Schematic showing how centromere positions were assigned via measuring K-fiber length relative to the half spindle. Centromeres attached to short K-fibers, which are on the same side of the metaphase plate as the pole they are attached to, were assigned negative centromere-to-metaphase plate values. Centromeres attached to long K-fibers were assigned positive centromere-to-metaphase plate values. (B) Plots of switch rate for both poleward to away-from-pole (P to AP) and away-from-pole to poleward (AP to P) switches as a function of position on the spindle, expressed as K-fiber length relative to the half spindle. Switch rates were measured from the populations of kinesin-depleted cells described in Table 1. Error bars represent uncertainty due to counting statistics. (C) Plots of switch rate as a function of intercentromere distance for both P to AP and AP to P switches in control and Kif18A-depleted cells. None of the kinesin depletions tested changed this correlation (see also Figure S3 C–D). Error bars represent uncertainty due to counting statistics. (D) Plots of intercentromere distance as a function of the position of the center of mass of the centromere pair relative to the metaphase plate during motion of the pair towards the left pole (solid line) and towards the right pole (dashed line). Positions of centromere pairs were determined essentially as described in (A), but the distance between the metaphase plate and the point midway between the two sister centromeres, center of mass (COM) position, was measured. Error bars indicate SEM.
Figure 4
Figure 4
Kid and Kif4A oppositely tune the polar ejection force. (A) Following a 2-hour treatment with 100 µM monastrol, HeLa cells pre-treated with the indicated siRNAs were fixed and processed for immunofluorescence. DNA was stained with DAPI (blue), kinetochores were visualized with Crest serum (green) and centrosomes were localized with anti-γ-tubulin antibodies. Scale bar is 5 µm. Kinetochore (KT)-to-pole distances measured in cells treated with the indicated siRNAs and the mean ± SEM from the analysis of the indicated number of cells (n) is reported for each distribution. Distributions are displayed in Figure S4. p-values calculated from comparison to control siRNA cells are 0.0001 (Kid siRNA) and 0.03 (Kif4A siRNA). (B) Graph of KT-to-pole distances measured in monopolar HCT116 cells expressing GFP (black bars), GFP-Kid (green bars) or GFP-Kif4A (orange bars) and treated with the indicated siRNAs. Error bars are SEM. The following data sets are significantly different (p < 0.001) from the GFP/control-siRNA data set in a two-tailed t-test comparison: GFP/Kid-siRNA, GFP/Kif4A-siRNA, GFP-Kid/control-siRNA and GFP-Kid/Kif4A-siRNA. GFP/Kif4A-siRNA is also significantly different from GFP-Kif4A/Kif4A-siRNA (p = 0.001).
Figure 5
Figure 5
Kif4A suppresses microtubule dynamics in cells. (A) An EB3-GFP expressing cell that was imaged to measure microtubule polymerization rates. Scale bar is 5 µm. (B) Kymograph of EB3-GFP generated from the region indicated by the white box in (A). Horizontal scale bar is 5 µm, vertical scale bar is 1 minute. (C) Plot of microtubule (MT) polymerization rates as a function of EB3-GFP fluorescence. Horizontal lines indicate means and error bars indicate SEM. r = 0.27 from a Pearson correlation analysis of control cells, indicating that EB3-GFP expression is not strongly correlated with microtubule polymerization rate in the analyzed cells. (D) Average microtubule (MT) polymerization rates measured in cells treated with siRNAs targeting the indicated kinesins. p-values calculated from comparison to control siRNA measurements (n = 14 cells) are 0.048 (Kif4A siRNA, n = 7 cells), 0.29 (Kid siRNA, n = 10 cells) and 0.49 (Kif18A siRNA, n = 8 cells). Error bars indicate SEM. (E) A live interphase cell expressing a truncated version of Kif4A (GFP-dKif4A) that accumulates in the cytoplasm on microubule plus-ends. The edge of the cell membrane is indicated (dotted line). (F) A live interphase cell expressing a mutated version of Kid (GFP-nlsKid) that accumulates on cytoplasmic microtubules. In contrast to GFP-dKif4A, GFP-Kid-NLS primarily localizes to the microtuble lattice rather than plus-ends.
Figure 6
Figure 6
Kif18A and Kif4A suppress microtubule dynamics by promoting plus-end pausing while Kid does not. (A) Live Alexa561-labeled microtubules polarity marked with unlabeled, unstabilized seeds (s). Plus-ends (+) and minus-ends are indicated (−). (B) Representative kymographs of live microtubule plus-ends at 37°C in the absence of motor. (C) Kymographs showing microtubule plus-end dynamics (red) in the presence of no motor (left panel); 25 nM GFP-Kif18A (green, middle panel) or 100nM GFP-Kif18A (green, right panel). Characteristically microtubules will still assemble in 25nM GFP-Kif18A but transitions to a pause state are common (*). In 100 nM GFP-Kif18A microtubules are often paused through the entire 300 sec. observation time. (D) Kymographs showing microtubule plus-end dynamics (red) in the presence of 35 nM GFP-Kif4A (left two panels) or GFP-Kid (right two panels). Microtubules appear to pause frequently (*) in the presence of GFP-Kif4A, while they remain dynamic in the presence of GFP-Kid. (E) Plot of the fraction of time microtubules spent in a paused state as a function of motor concentration ([motor]). GFP-Kif18A and GFP-Kif4A increased the proportion of time microtubules spent paused in a dose dependent manner. P<0.0001 for all concentrations. In contrast, GFP-Kid did not significantly increase the proportion of time microtubules spent paused. Note that it was necessary to analyze Kif18A and chromokinesins under slightly different buffer conditions to optimize for motor solubility (see Experimental Procedures for details). Error bars indicate SEM. (F) Model for control of chromosome movement by Kid, Kif4A and Kif18A. In control cells (top) switch rates are strictly dependent on position within the spindle and are controlled via direct suppression of K-fiber dynamics by Kif18A. In Kif18A/Kif4A depleted cells (bottom) switch rates are also dependent on position, but switching is now influenced by kinetochore tension.

References

    1. Akiyoshi B, Sarangapani KK, Powers AF, Nelson CR, Reichow SL, Arellano-Santoyo H, Gonen T, Ranish JA, Asbury CL, Biggins S. Tension directly stabilizes reconstituted kinetochore-microtubule attachments. Nature. 2010;468:576–579. - PMC - PubMed
    1. Antonio C, Ferby I, Wilhelm H, Jones M, Karsenti E, Nebreda AR, Vernos I. Xkid, a chromokinesin required for chromosome alignment on the metaphase plate. Cell. 2000;102:425–435. - PubMed
    1. Bieling P, Kronja I, Surrey T. Microtubule Motility on Reconstituted Meiotic Chromatin. Curr Biol. 2010a - PubMed
    1. Bieling P, Telley IA, Surrey T. A Minimal Midzone Protein Module Controls Formation and Length of Antiparallel Microtubule Overlaps. Cell. 2010b;142:420–432. - PubMed
    1. Bringmann H, Skiniotis G, Spilker A, Kandels-Lewis S, Vernos I, Surrey T. A kinesin-like motor inhibits microtubule dynamic instability. Science. 2004;303:1519–1522. - PubMed

Publication types