. 2012 Oct;19(10):1698-708.
doi: 10.1038/cdd.2012.52. Epub 2012 May 18.

The role of autophagy in the pathogenesis of glycogen storage disease type II (GSDII)

Affiliations

The role of autophagy in the pathogenesis of glycogen storage disease type II (GSDII)

A C Nascimbeni et al. Cell Death Differ. 2012 Oct.

Abstract

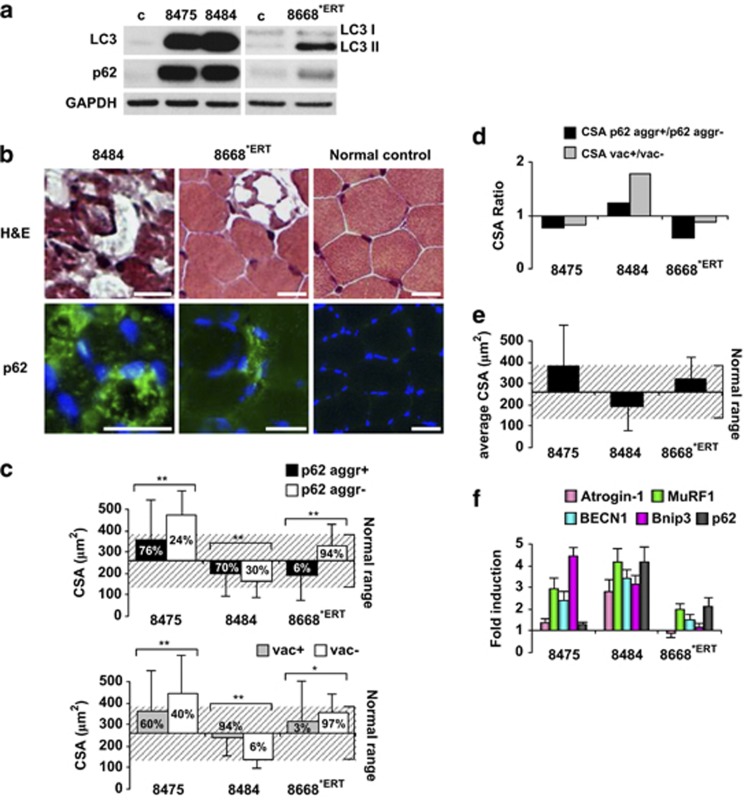
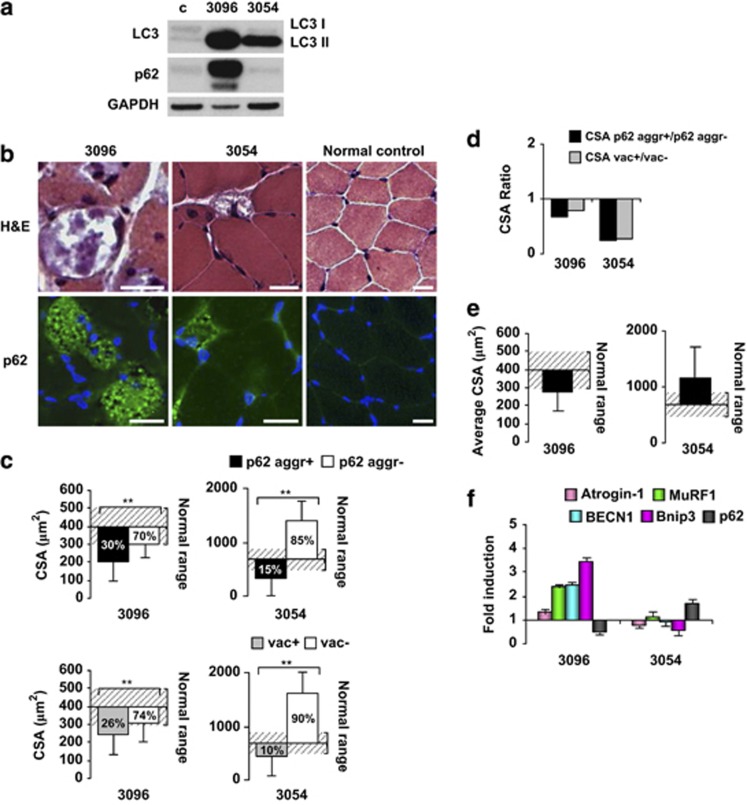
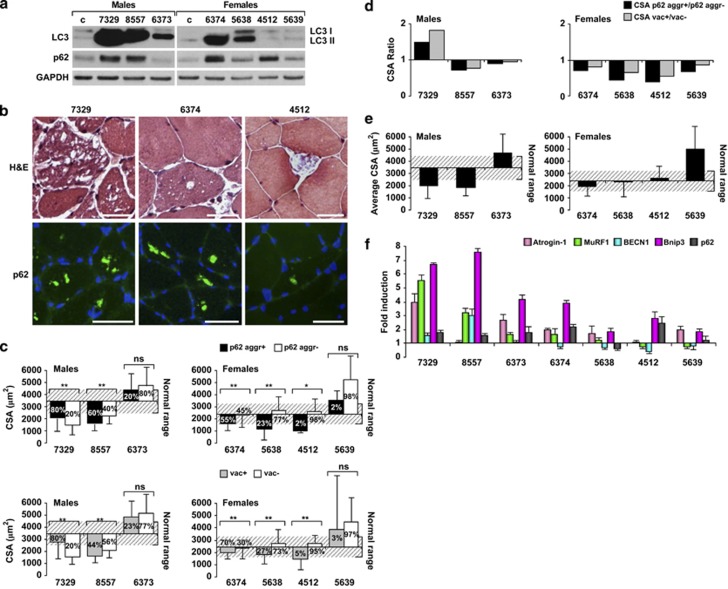
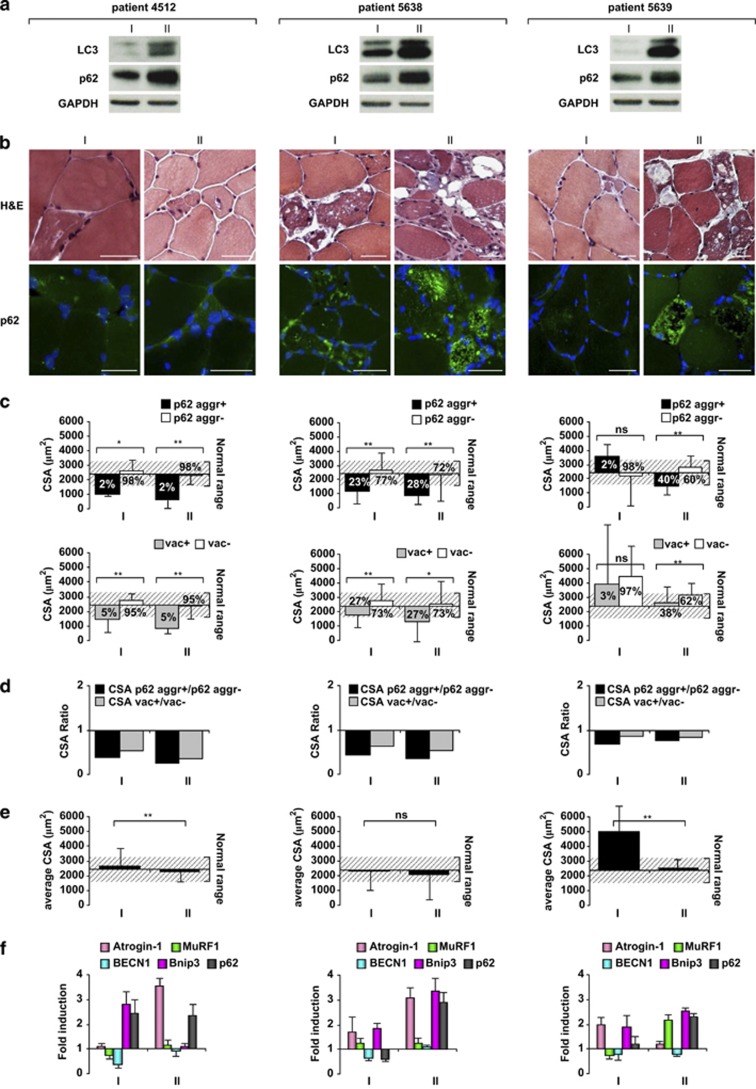
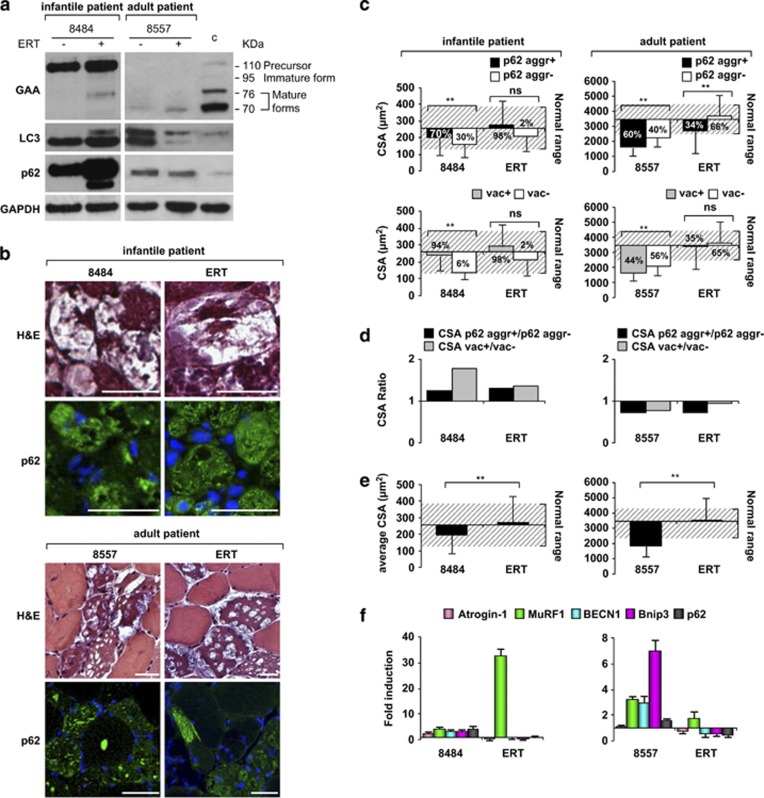
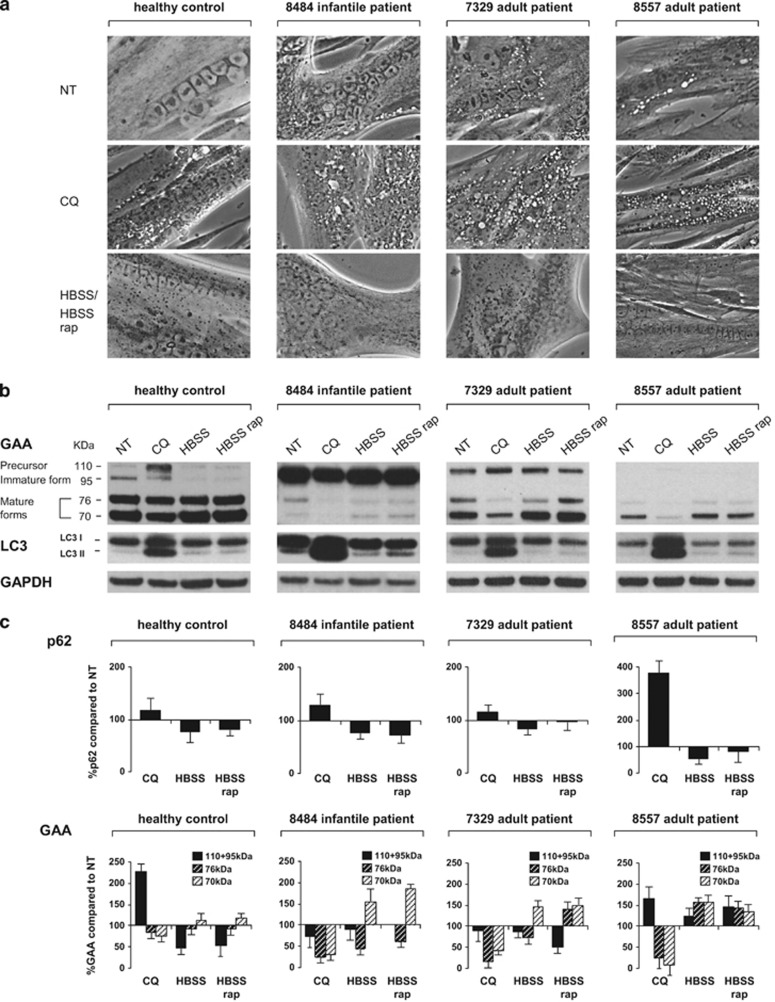
Regulated removal of proteins and organelles by autophagy-lysosome system is critical for muscle homeostasis. Excessive activation of autophagy-dependent degradation contributes to muscle atrophy and cachexia. Conversely, inhibition of autophagy causes accumulation of protein aggregates and abnormal organelles, leading to myofiber degeneration and myopathy. Defects in lysosomal function result in severe muscle disorders such as Pompe (glycogen storage disease type II (GSDII)) disease, characterized by an accumulation of autophagosomes. However, whether autophagy is detrimental or not in muscle function of Pompe patients is unclear. We studied infantile and late-onset GSDII patients and correlated impairment of autophagy with muscle wasting. We also monitored autophagy in patients who received recombinant α-glucosidase. Our data show that infantile and late-onset patients have different levels of autophagic flux, accumulation of p62-positive protein aggregates and expression of atrophy-related genes. Although the infantile patients show impaired autophagic function, the late-onset patients display an interesting correlation among autophagy impairment, atrophy and disease progression. Moreover, reactivation of autophagy in vitro contributes to acid α-glucosidase maturation in both healthy and diseased myotubes. Together, our data suggest that autophagy protects myofibers from disease progression and atrophy in late-onset patients.


Figures

Figure 1
Figure 1
Characterization of autophagy and atrophy in infantile-onset GSDII patients. (a) Immunoblot analysis of LC3, p62 and the loading control (GAPDH). c: age-matched healthy control; numbers: patient identifier; *ERT: patient subjected to ERT prior to biopsy. (b) H&E staining and p62 immunohistochemistry: example of two patients and a normal control. Bar: 20 μm. (c) CSA of fibers showing p62 aggregates (p62 aggr+) compared with fibers without p62 aggregates (p62 aggr−) and vacuolated (vac+) compared with non-vacuolated (vac−) fibers, relative to healthy age- and sex-matched controls (mean CSA of controls: 258±124 μm2; dashed box: normal CSA range). The percentages of p62 aggregate-positive, negative, vacuolated and non-vacuolated fibers are reported in the bars. **P<0.0001; *P<0.05. n>200 fibers measured. (d) CSA ratio of p62 aggregate-positive versus negative and vacuolated versus non-vacuolated fibers. When the size of fibers containing p62 aggregates is smaller than the negative fibers it will result in a ratio below 1. Identical consideration applies to vacuolated fibers. (e) Average CSA of all the muscle fibers. (f) qRT-PCR analysis of the atrophy-related genes and of p62. The fold induction is compared with the age-matched control and normalized to GAPDH
Figure 2
Figure 2
Characterization of autophagy and atrophy in childhood-onset GSDII patients. (a) Immunoblot analysis of LC3, p62 and the loading control (GAPDH). (b) H&E staining and p62 immunohistochemistry. Bar: 20 μm. (c) CSA of fibers showing p62 aggregates (p62 aggr+) compared with fibers without p62 aggregates (p62 aggr−) and vacuolated (vac+) compared with non-vacuolated (vac−) fibers, relative to healthy age- and sex-matched controls (4-year-old controls mean CSA: 395±79 μm2; 7-year-old controls mean CSA: 681±193 μm2; dashed box: normal CSA range). The percentages of p62-positive, negative, vacuolated and non-vacuolated fibers are reported in the bars. **P<0.0001. n>200 fibers measured. (d) CSA ratio of p62-aggregates positive versus negative and vacuolated versus non-vacuolated fibers. (e) Mean of CSA of total myofibers. (f) qRT-PCR analysis. Fold induction is compared with the age-matched control and normalized to GAPDH
Figure 3
Figure 3
Characterization of autophagy and atrophy in adult-onset GSDII patients. (a) Immunoblot analysis of LC3, p62 and the loading control (GAPDH). (b) H&E staining and p62 immunohistochemistry. Bar: 40 μm. (c) CSA of fibers showing p62 aggregates (p62 aggr+) compared with fibers without p62 aggregates (p62 aggr−) and vacuolated (vac+) compared with non-vacuolated (vac−) fibers, relative to healthy age- and sex-matched controls (female controls mean CSA: 2419±786 μm2; male controls mean CSA: 3446±950 μm2; dashed box: normal CSA range). The percentages of p62-positive, negative, vacuolated and non-vacuolated fibers are reported in the bars. **P<0.0001; *P<0.05; ns: not significant. n>200 fibers measured. (d) CSA ratio of p62-aggregates positive/negative and vacuolated/non-vacuolated fibers. (e) Total average CSA. (f) qRT-PCR analysis. Fold induction is compared with the age-matched control and normalized to GAPDH
Figure 4
Figure 4
Comparison of different staged biopsies. (a) Immunoblot analysis of LC3, p62 and the loading control (GAPDH). I: first biopsy; II: second biopsy. (b) H&E staining and p62 immunohistochemistry. Bar: 40 μm. (c) CSA of fibers showing p62 aggregates (p62 aggr+) compared with fibers without p62 aggregates (p62 aggr−) and vacuolated (vac+) compared with non-vacuolated (vac−) fibers, relative to healthy age- and sex-matched controls (mean CSA for female controls: 2419±786 μm2; dashed box: normal CSA range). The percentages of p62-positive, negative, vacuolated and non-vacuolated fibers are reported in the bars. **P<0.0001; *P<0.05; ns: not significant. n>200 fibers measured. (d) CSA ratio of p62-aggregates positive/negative and vacuolated/non-vacuolated fibers. (e) Average CSA of all the muscle fibers. **P<0.0001; ns: not significant. (f) qRT-PCR analysis. Fold induction is compared with the age-matched control and normalized to GAPDH
Figure 5
Figure 5
Comparison of pre- and post-ERT biopsies. (a) Immunoblot analysis of LC3, p62 and the loading control (GAPDH). ERT−: pre-ERT biopsy; ERT+: post-ERT biopsy; (b) H&E staining and p62 immunohistochemistry. ERT: post-ERT biopsy. Bar: 40 μm. (c) CSA of fibers showing p62 aggregates (p62 aggr+) compared with fibers without p62 aggregates (p62 aggr−) and vacuolated (vac+) compared with non-vacuolated (vac−) fibers, relative to healthy age- and sex-matched controls (mean CSA of infantile-onset controls: 258±124 μm2; mean CSA of adult male controls: 3446±950 μm2). The percentages of p62-positive, negative, vacuolated and non-vacuolated fibers are reported in the bars. **P<0.0001; ns: not significant. n>200 fibers measured. (d) CSA ratio of p62-aggregates positive/negative and vacuolated/non-vacuolated fibers. (e) Average CSA of all the muscle fibers. **P<0.0001. (f) qRT-PCR analysis. Fold induction is compared with the age-matched control and normalized to GAPDH
Figure 6
Figure 6
Induction/inhibition of autophagy in cultured healthy and patients' myotubes: autophagy enhances GAA processing into mature lysosomal forms. (a) Bright-field images of myotubes. NT: untreated; CQ: chloroquine-treated (50 μM CQ for 20 h in full medium); HBSS: starvation medium (HBSS for 40 h); HBSS rap: starvation medium with rapamycin (HBSS with 0.3 μM rapamycin for 40 h). (b) Immunoblot analysis of GAA, LC3 and the loading control (GAPDH). NT: untreated; CQ: chloroquine-treated; HBSS: starvation medium; HBSS rap: starvation medium with rapamycin. (c) Densitometric analysis of p62 and GAA levels from different blots. Expression of inactive and active GAA forms (110 and 95 kDa: inactive precursor and immature forms, respectively; 76 and 70 kDa: mature lysosomal forms) in different conditions (autophagy inhibition: CQ; autophagy induction: HBSS and HBSS rap) compared with untreated myotubes (NT)

References

    1. Mizushima N, Levine B, Cuervo AM, Klionsky DJ. Autophagy fights disease through cellular self-digestion. Nature. 2008;451:1069–1075. - PMC - PubMed
    1. Mammucari C, Milan G, Romanello V, Masiero E, Rudolf R, Del Piccolo P, et al. FoxO3 controls autophagy in skeletal muscle in vivo. Cell Metab. 2007;6:458–471. - PubMed
    1. Engel AG, Hirschhorn R, Huie ML.Acid maltase deficiencyIn: Engel AG, Franzini-Armstrong C (eds).Myology McGraw-Hill Press: New York; 20041559–1586.
    1. Nishino I, Fu J, Tanji K, Yamada T, Shimojo S, Koori T, et al. Primary LAMP-2 deficiency causes X-linked vacuolar cardiomyopathy and myopathy (Danon disease) Nature. 2000;406:906–910. - PubMed
    1. Kalimo H, Savontaus ML, Lang H, Paljärvi L, Sonninen V, Dean PB, et al. X-linked myopathy with excessive autophagy: a new hereditary muscle disease. Ann Neurol. 1988;23:258–265. - PubMed

Publication types

MeSH terms