Review
. 2012 May 18;13(6):407-20.
doi: 10.1038/nrn3241.

The origin of extracellular fields and currents--EEG, ECoG, LFP and spikes

Affiliations
Review

The origin of extracellular fields and currents--EEG, ECoG, LFP and spikes

György Buzsáki et al. Nat Rev Neurosci. .

Abstract

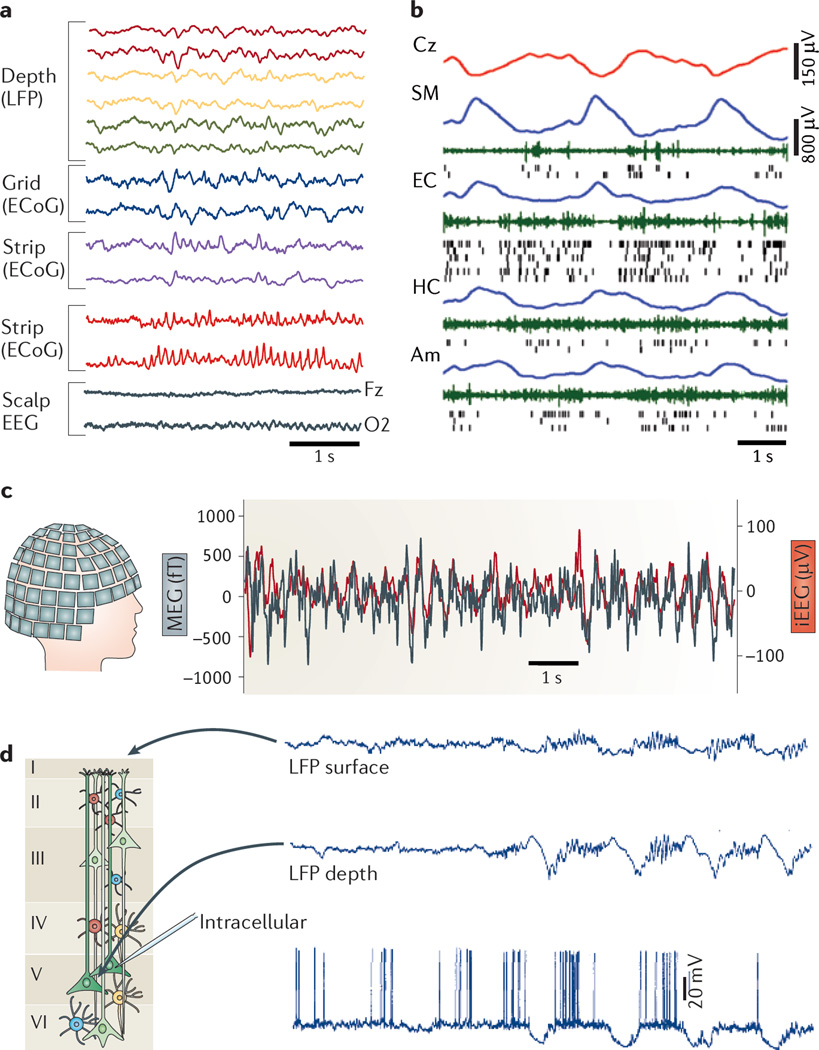
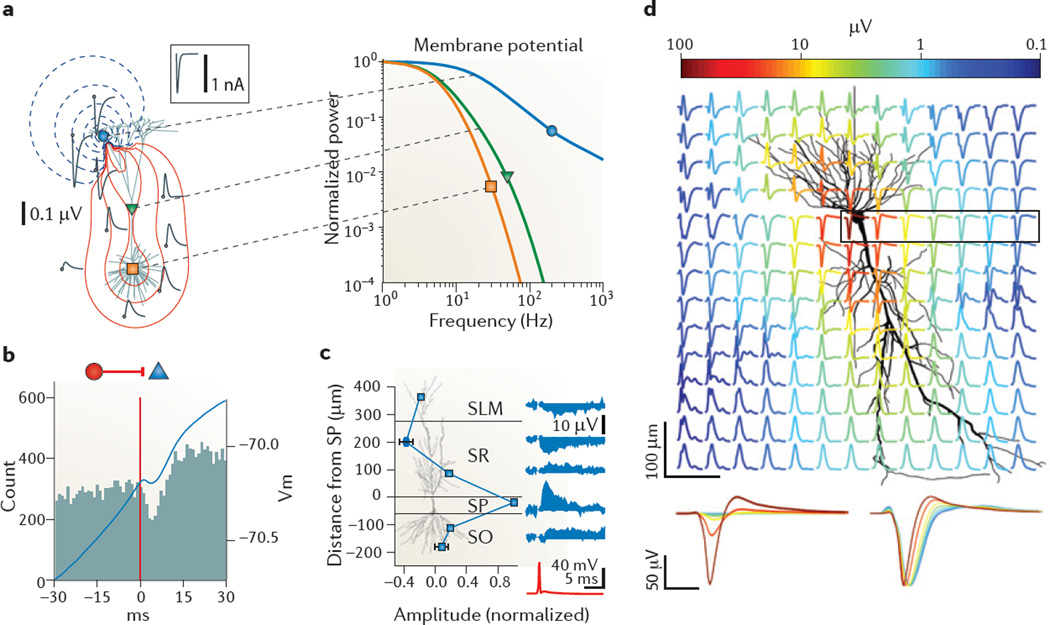
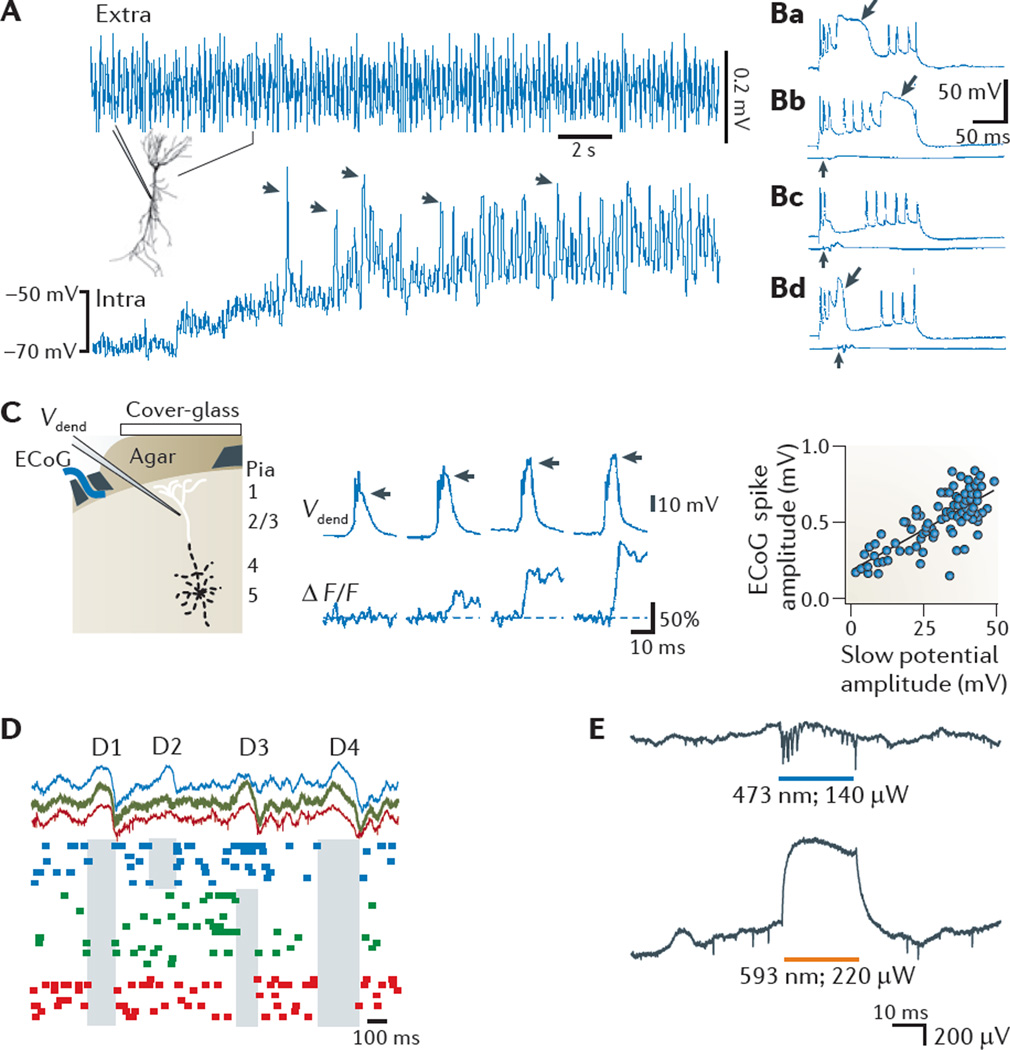
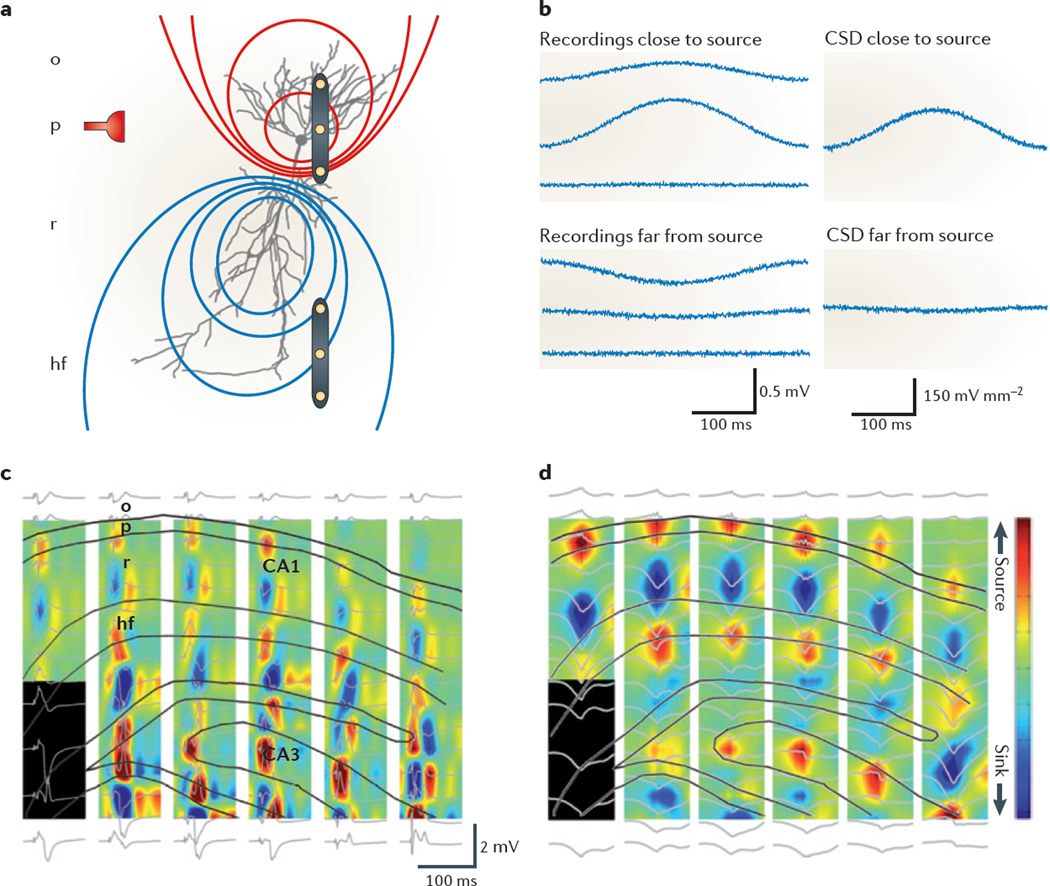
Neuronal activity in the brain gives rise to transmembrane currents that can be measured in the extracellular medium. Although the major contributor of the extracellular signal is the synaptic transmembrane current, other sources--including Na(+) and Ca(2+) spikes, ionic fluxes through voltage- and ligand-gated channels, and intrinsic membrane oscillations--can substantially shape the extracellular field. High-density recordings of field activity in animals and subdural grid recordings in humans, combined with recently developed data processing tools and computational modelling, can provide insight into the cooperative behaviour of neurons, their average synaptic input and their spiking output, and can increase our understanding of how these processes contribute to the extracellular signal.


Figures

Figure 1
Figure 1. Extracellular traces using different recording methods are fundamentally similar
a | Simultaneous recordings from three depth electrodes (two selected sites each) in the left amygdala and hippocampus (measuring the local field potential (LFP)); a 3 × 8 subdural grid electrode array placed over the lateral left temporal cortex (measuring the electrocorticogram (ECoG); two four-contact strips placed under the inferior temporal surface (measuring the ECoG); an eight-contact strip placed over the left orbitofrontal surface (measuring the ECoG); and scalp electroencephalography (EEG) over both hemispheres (selected sites are the Fz and O2) in a patient with drug-resistant epilepsy. The amplitude signals are larger and the higher-frequency patterns have greater resolution at the intracerebral (LFP) and ECoG sites compared to scalp EEG. b | A 6 s epoch of slow waves recorded by scalp EEG (Cz, red), and LFP (blue) recorded by depth electrodes placed in the deep layers of the supplementary motor area (SM) and entorhinal cortex (EC), hippocampus (HC) and amygdala (Am). Also shown are multiple-unit activity (green) and spikes of isolated neurons (black ticks). c | Simultaneously recorded magnetoencephalogram (MEG; black) and anterior hippocampus depth EEG (red) from a patient with drug-resistant epilepsy. Note the similar theta oscillations recorded by the depth electrode and the trace calculated by the MEG, without any phase delay. d | Simultaneously recorded LFP traces from the superficial (‘surface’) and deep (‘depth’) layers of the motor cortex in an anaesthetized cat and an intracellular trace from a layer 5 pyramidal neuron. Note the alternation of hyperpolarization and depolarization (slow oscillation) of the layer 5 neuron and the corresponding changes in the LFP. The positive waves in the deep layer (close to the recorded neuron) are also known as delta waves. iEEG, intracranial EEG. Part a courtesy of G. Worrell, Mayo Clinic, Minneapolis, Minnesota, USA, and S. Makeig, University of California at San Diego, USA. Part b is reproduced, with permission, from REF. © (2011) Cell Press. Part c courtesy of S. S. Dalal, University of Konstanz, Germany, and J.-P. Lachaux and L. Garnero, Université de Paris, France. Part d is reproduced, with permission, from REF. © (1995) Society for Neuroscience.
Figure 2
Figure 2. Excitatory and inhibitory postsynaptic currents are the most ubiquitous contributors to Ve
a | Computer-simulated local field potential (LFP) traces (left panel; grey) in response to an excitatory synaptic current input (a sink, shown by the blue circle) injected into the distal apical dendrite of a purely passive layer 5 pyramidal model neuron. The waveform of the injected current is illustrated in the box. Red and blue contour lines correspond to positive and negative values for the LFP amplitude, respectively. The calculated double logarithmic power spectra of the transmembrane potential are also shown (right panel), following injection of current into the apical dendrite near the injection site (blue trace), mid-apical dendrite (green trace) and soma (orange trace). Note that high-frequency activity decreases with the distance from the active synaptic site (that is, the sink). b | A monosynaptic inhibitory connection between a putative layer 3 entorhinal cortical interneuron (red circle) and intracellularly recorded pyramidal cell (blue triangle). Below it, a cross-correlogram between the spikes of the reference interneuron (at time 0, red line) and the pyramidal cell and, superimposed on it, the spike-triggered average of the membrane potential (Vm) of the pyramidal cell (in blue). Note the small, short-latency hyperpolarization (the dip) superimposed on the rising phase of the intracellular theta oscillation and the corresponding decreased spike discharge of the pyramidal cell. c | Inhibition-induced LFPs. LFPs were generated in the vicinity of a pyramidal neuron (bottom cell) by intracellularly induced action potentials in a nearby basket cell (top cell), and were recorded extracellularly at six sites in multiple layers of the hippocampus. The mean LFP amplitude at each site is shown by the blue squares. Example LFP traces (blue) from six sites and the action potential of the basket cell (red trace) are shown on the right. Note that the largest positive response by inhibition-induced hyperpolarization occurs near the soma. d | Extracellular contribution of an action potential (‘spike’) to the LFP in the vicinity of the spiking pyramidal cell. The magnitude of the spike is normalized. The peak-to-peak voltage range is indicated by the colour of the traces. Note that the spike amplitude decreases rapidly with distance from the soma, without a change in polarity within the pyramidal layer (the approximate area of which is shown by the box), in contrast to the quadrupole (that is, reversed polarity signals both above and below the pyramidal layers) formed along the somatodendritic axis. The distance-dependence of the spike amplitude within the pyramidal layer is shown (bottom left panel) with voltages drawn to scale, using the same colour identity as the traces in the boxed area in d. The same traces are shown normalized to the negative peak (bottom right panel). Note the widening of the spike with distance from the soma, owing to greater contributions from dendritic currents and intrinsic filtering of high-frequency currents by the cell membrane. SLM, stratum lacunosum moleculare; SO, stratum oriens; SP, stratum pyramidale; SR, stratum radiatum. Part a is reproduced, with permission, from REF. © (2010) Springer. Part b is reproduced, with permission, from REF. © (2010) Society for Neuroscience. Part c is reproduced from REF. © (2009) Macmillan Publishers Ltd. All rights reserved. Part d courtesy of E. W. Schomburg, California Institute of Technology, USA.
Figure 3
Figure 3. Non-synaptic contributions to the LFP
Ca2+ spikes, disfacilitation and disinhibition contribute to the local field potential (LFP). A | Voltage-dependence of a theta-frequency oscillation in a hippocampal pyramidal cell dendrite in vivo. A continuous recording of extracellular (extra) and intradendritic (intra) activity in a hippocampal CA1 pyramidal cell is shown. The holding potential was manually shifted to progressively more depolarized levels by intradendritic current injection. The recording electrode contained QX-314 to block Na+ spikes. Note the large increase in the amplitude of the intradendritic theta oscillation upon depolarization. Arrows, putative high-threshold Ca2+ spikes phase-locked to the LFP theta oscillation. Ba | Dendritic Ca2+ spikes (shown by an arrow) have a large amplitude and are long-lasting in vivo. BbBd | The response of a CA1 pyramidal cell to ventral hippocampal commissural stimulation (vertical arrows) paired with dendritic depolarization. Such inhibition can delay (Bb), prevent (Bc) or abort (Bd) the dendritic Ca2+ spike. LFPs recorded from a nearby electrode in the pyramidal layer show the timing and magnitude of the stimulation (lower traces in BbBd). Note that the number of Na2+ spikes remains approximately the same, irrespective of the presence or absence of the Ca2+ spike. C | Whisker stimulation-evoked dendritic Ca2+ spikes correlate with surface cortical LFP changes. The setup for recording the electrocorticogram (ECoG), intradendritic potential (Vdend) and Ca2+ fluorescence is shown in the left panel. The relationship between the intradendritic potential amplitude (horizontal arrows) and simultaneously measured Ca2+ influx (ΔF/F) is shown in the middle panel. The ECoG response as a function of the Ca2+ spike (‘slow potential’) amplitude is shown in the right panel. D | ‘Down’ states in cortical pyramidal cells during sleep produce extracellular LFP ‘delta’ waves. Shown are simultaneously recorded LFP (top) and unit activity (bottom) at three layer 5 intracortical locations (spaced approximately 1 mm apart; indicated by different colours). Note that down states (shaded areas), reflected as positive waves (delta waves) in the LFP, can be either strongly localized (in D2 and D3) or more widespread (in D1 and D4). E | Generation of extracellular potentials by depolarization or hyperpolarization of a limited number of CA1 neurons that express both channelrhodopsin 2 (ChR2) and halorhodopsin, in response to blue (top) and yellow (bottom) light in vivo. Note the depolarization-induced negative LFP (top) and the hyperpolarization-induced positive LFP (bottom) in the pyramidal layer. Part A is reproduced, with permission, from REF. © (1998) Wiley. Part B is reproduced, with permission, from REF. © (1996) National Academy of Sciences. Part C is reproduced from REF. © (1999) Macmillan Publishers Ltd. All rights reserved. Part D is reproduced, with permission, from REF. © (2005) Cambridge Journals. Part E courtesy of E. Stark, New York University, Langone Medical Center, USA.
Figure 4
Figure 4. Identifying current sources
a | A current source–sink dipole, embedded in a homogeneous and isotropic conductive medium, that is induced by barrage-like inhibitory input (shown by the red symbol) impinging on the perisomatic region. Lines show the iso-potentials (red, positive; blue, negative). A triplet of linearly and equally spaced recording electrodes (shown in yellow) is located near the soma (top), that is, close to the current source, and another is located far from the current source. b | Ve traces (left panels) measured at the three equally spaced locations relative to an ideal infinite (reference) site. The middle trace in the top panel is from the electrode positioned closest to the soma. The voltage contribution induced by the active dipole decays in the medium as the inverse square of the distance (compare with FIG. 2a). The current source density (CSD) traces (right panels) are calculated from the voltage traces. Although dipole-induced Ve can be measured far from the source, CSD is spatially confined and can therefore help to identify the anatomical location of the dipole. c | Simultaneous recordings from 96 sites (six shanks (represented by columns in the figure) with 16 recording sites each (LFP traces shown in grey)) in a behaving rat. Simultaneously recorded evoked field responses in the CA1–dentate gyrus axis of the rat hippocampus (black lines show the outline of the layers) in response to electrical stimulation of entorhinal afferents are shown. Such trisynaptic activation of CA1 pyramidal cells is reflected as negative LFP (and sink, blue) in the apical dendritic layer (stratum radiatum, r). The black rectangle indicates missing channels. d | A CSD map of average spontaneously occurring sharp waves. Note the nearly identical distribution of sinks and sources in CA1 during the evoked responses and sharp waves, supporting the idea that sharp waves reflect CA3-induced depolarization of the apical dendrites of CA1 neurons. Selective activation of known afferents thus can be used to ‘calibrate’ the locations of sinks and sources, and relate them to the CSD distribution of spontaneously occurring LFP events. hf, stratum lacunosum-moleculare; o, stratum oriens; p, pyramidal layer. Parts c and d courtesy of J. Csicsvari, Institute of Science and Technology, Austria, and D. Sullivan, New York University, Langone Medical Center, USA.
Figure 5
Figure 5. Spike contribution to the LFP
a | Average multiunit recording of the visual cortex of a monkey during presentation of a static grating (0 to 400 ms) at six different sizes, shown in different colours (left panel). Also shown are time–frequency–power difference plots demonstrating the difference between baseline power (in dB) and power in response to increasing size stimuli (right panel). Note the increase in wide-band power (at ~50 ms) with increased firing and synchrony of units after stimulus onset. The arrow indicates sustained gamma frequency oscillation. b | The effect of local field potential (LFP) ‘de-spiking’ on spectral power. The figure shows the percentage change of power at different frequencies after de-spiking the LFP. Thick lines indicate the frequencies at which there was a significant difference between the original LFP power and the power of the LFP after removing interneuron spikes (No interneurons), pyramidal cell spikes (No pyramidal cells) or all spikes (No spikes). Part a is reproduced from REF. . Part b is reproduced, with permission, from REF. © (2012) Society for Neuroscience.
Figure 6
Figure 6. Spikes are embedded in unique synapsembles and spatially distributed LFP
Spike-triggered averages of the local field potential (LFP) in the hippocampus during exploration (left panel) and sleep (right panel). During exploration, spikes were sampled while the rat ran on a linear track for a water reward; during sleep, spikes were sampled during sharp wave-ripples (SPW-R). Recordings were made by an eight-shank (300 µm intershank distance), 256-site silicon prove (32 recording sites on each shank, linerarly spaced 50 µm apart). The LFP was smoothed both within and across shanks. The LFP was triggered by the spikes of a fast-firing putative interneuron in CA1 stratum oriens (ori; shown by a star). Both panels show a 100 µs snapshot of the LFP map at the time of the spike occurrence. Note that during exploration (left panel), the spike is associated with synaptic activity (negative wave, hot colours) mainly in the stratum lacunosum-moleculare (lm; shown by an arrow) and the dentate molecular layer (mol), indicating entorhinal cortex activation. During sleep (right panel), activity arises in CA3 and invades the CA1 stratum radiatum (rad; shown by an arrow). We propose that such LFP ‘snapshots’ reflect unique constellations of cell assemblies responsible for the discharge of the neuron. The LFP map changes characteristically with time (see Supplementary information S1 and S2 (movies)). We suggest that the time-evolving constellation of the LFP map or vector reflects a unique distribution of postsynaptic potentials (that is, synapsembles) brought about by the evolving spike assemblies within and upstream of the hippocampus. Sufficiently high-density LFP recordings can therefore be informative of the evolving cell assemblies that bring about the LFP changes. gc, granule cell layer; hil, hilus; pyr, pyramidal layer. Figure courtesy of A. Berényi and Z. Somogyvári, New York University, Langone Medical Center, USA.

Similar articles

Cited by

References

    1. Petsche H, Pockberger H, Rappelsberger P. On the search for the sources of the electroencephalogram. Neuroscience. 1984;11:1–27. An excellent review of the sources of the local field.

    1. Hämäläinen M, Hari R, Ilmoniemi RJ, Knuutila J, Lounasmaa OV. Magnetoencephalography — theory, instrumentation, and applications to noninvasive studies of the working human brain. Rev. Mod. Phys. 1993;65:413–497. An exhaustive review of and excellent tutorial on the theory and methods of MEG.

    1. Bokil H, Andrews P, Kulkarni JE, Mehta S, Mitra PP. Chronux: a platform for analyzing neural signals. J. Neurosci. Methods. 2010;192:146–151. - PMC - PubMed
    1. Crone NE, Korzeniewska A, Franaszczuk PJ. Cortical gamma responses: searching high and low. Int. J. Psychophysiol. 2011;79:9–15. - PMC - PubMed
    1. Buzsáki G, Draguhn A. Neuronal oscillations in cortical networks. Science. 2004;304:1926–1929. - PubMed

Publication types

Substances