. 2012 Jun 1;7(6):542-50.
doi: 10.4161/epi.20523. Epub 2012 Jun 1.

Whole-genome bisulfite DNA sequencing of a DNMT3B mutant patient

Affiliations

Whole-genome bisulfite DNA sequencing of a DNMT3B mutant patient

Holger Heyn et al. Epigenetics. .

Abstract

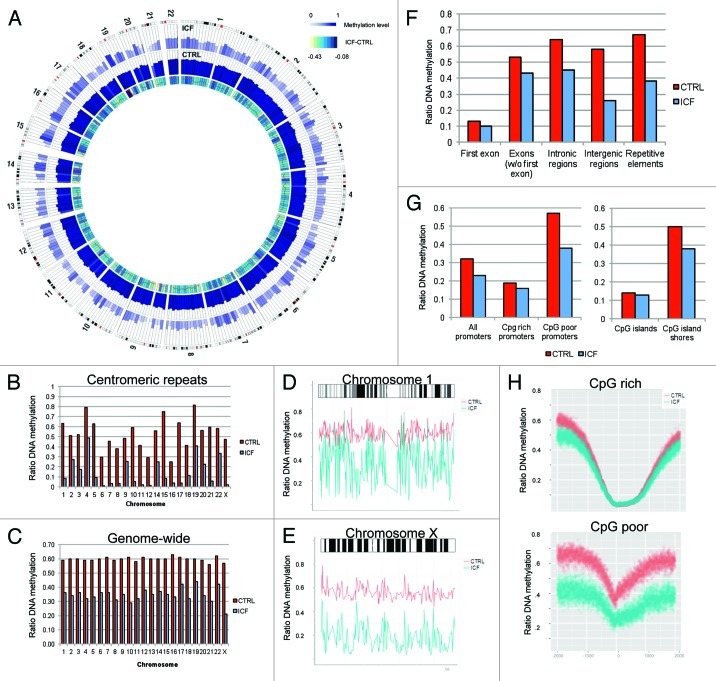
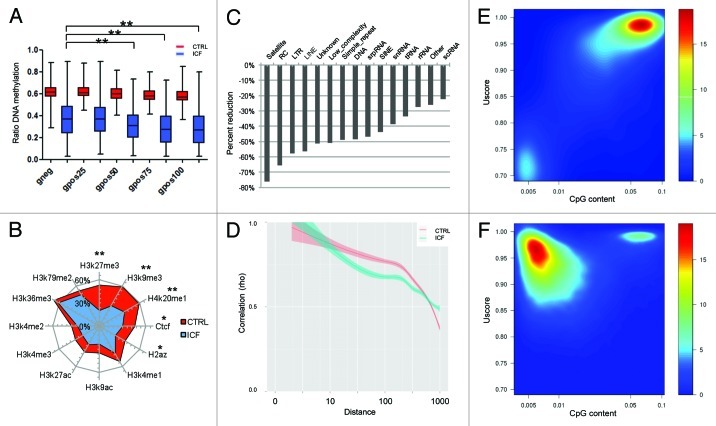
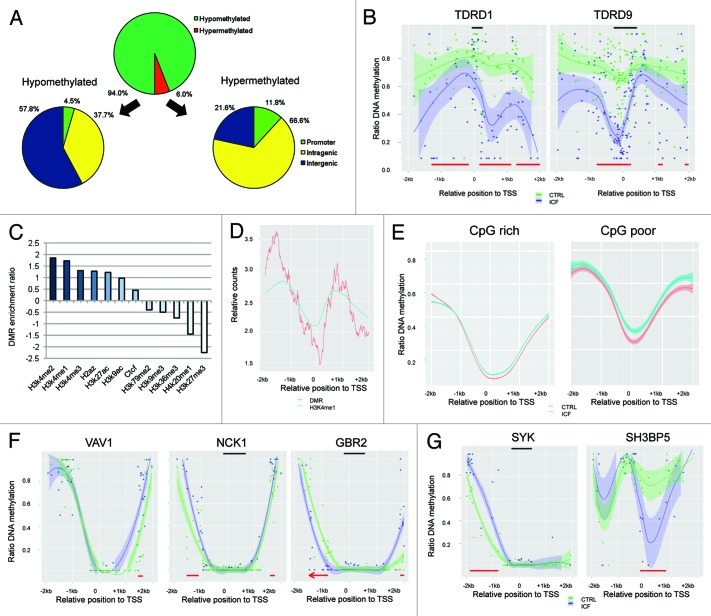
The immunodeficiency, centromere instability and facial anomalies (ICF) syndrome is associated to mutations of the DNA methyl-transferase DNMT3B, resulting in a reduction of enzyme activity. Aberrant expression of immune system genes and hypomethylation of pericentromeric regions accompanied by chromosomal instability were determined as alterations driving the disease phenotype. However, so far only technologies capable to analyze single loci were applied to determine epigenetic alterations in ICF patients. In the current study, we performed whole-genome bisulphite sequencing to assess alteration in DNA methylation at base pair resolution. Genome-wide we detected a decrease of methylation level of 42%, with the most profound changes occurring in inactive heterochromatic regions, satellite repeats and transposons. Interestingly, transcriptional active loci and ribosomal RNA repeats escaped global hypomethylation. Despite a genome-wide loss of DNA methylation the epigenetic landscape and crucial regulatory structures were conserved. Remarkably, we revealed a mislocated activity of mutant DNMT3B to H3K4me1 loci resulting in hypermethylation of active promoters. Functionally, we could associate alterations in promoter methylation with the ICF syndrome immunodeficient phenotype by detecting changes in genes related to the B-cell receptor mediated maturation pathway.


Figures

None
Figure 1. Whole genome bisulfite sequencing of a healthy (CTRL) and an ICF patient (ICF) sample. (A) Circos representation of genome-wide DNA methylation levels in the CTRL and ICF samples. Average levels for all the CGs in 297 10-Mbp-wide windows. Inner track indicates the magnitude of the difference between the CTRL and the ICF individual for each window (color scale and red line). Average methylation levels in all the regions are expressed as β values (0–1) and color-coded (blue). (B) DNA methylation level of centromeric regions of all 22 autosomes and the X chromosome displayed as ratio of methylated reads to unmethylated reads. (C) Genome-wide DNA methylation level of 22 autosomes and the X chromosome displayed as ratio of methylated reads to unmethylated reads. (D) DNA methylation profile of chromosome 1 for the CTRL (red) and the ICF sample (blue). (E) DNA methylation profile of chromosome X for the CTRL (red) and the ICF sample (blue). (F) DNA methylation level of genomic features displayed as ratio of methylated reads to unmethylated reads. (G) DNA methylation level of regulatory elements displayed as ratio of methylated reads to unmethylated reads. (H) DNA methylation profile of the promoter region (TSS +/− 2kb) of protein-coding genes for CpG rich (top) and poor (bottom) promoters of the CTRL (red) and ICF patient (blue) sample.
None
Figure 2. Distinct regions of aberrant methylation in the healthy (CTRL) and the ICF patient (ICF) sample. (A) DNA methylation level of genomic regions defined by Giemsa-staining. Displayed are all regions of one class (gneg: Giemsa-negative; gpos(25–100): Giemsa-positive (light-strong) as boxplot for the CTRL (red) and the ICF (blue) sample, with ** indicating significance (p < 0.01). (B) Average methylation level of genomic loci occupied by different histone marks, H2A.Z and CTCF. Displayed are the average DNA methylation levels in the analyzed regions, with significant differences indicated (** p < 0.01, * p < 0.05). (C) Relative reduction of average DNA methylation in different repetitive elements of the ICF sample compared with the CTRL. (D) Correlation of the DNA methylation status of neighboring CpGs in the CTRL (red) and the ICF (blue) sample. (E) Characterization of HMRs present in the CTRL sample in terms of DNA methylation level (Uscore) and CpG content. (F) Characterization of HMRs present in the ICF sample in terms of DNA methylation level (Uscore) and CpG content.
None
Figure 3. Differentially methylated regions (DMRs) in the healthy (CTRL) and the ICF patient (ICF) sample. (A) Distribution of DMR observed between the samples in terms of DNA methylation level and genomic location. (B) DNA methylation profiles of the promoter regions of the germline-specific genes TDRD1 (left) and TDRD9 (right) in the CTRL (green) and the ICF (blue) sample. DMRs (red bars) and CpG islands (black bars) are indicated. (C) Enrichment ratios (positive value: overrepresentation; negative values: underrepresentation) of hyper-DMRs in different histone marks, H2A.Z and CTCF. (D) Relative position counts of hyper-DMRs in H3K4me1 marked promoters. Displayed are relative counts for H3K4me1 occupancy and hyper-DMRs in a 10 bp window. (E) DNA methylation profile of promoter regions (TSS +/− 2kb) overlapping with hyper-DMRs of the CTRL (red) and the ICF (blue) sample. (F) DNA methylation profiles of the promoter regions of the B-cell maturation associated genes VAV1 (left), NCK1 (middle) and GBR2 (right) in the CTRL (green) and the ICF (blue) sample. DMRs (red bars) and CpG islands (black bars) are indicated. (G) DNA methylation profiles of the promoter regions of the BTK activator SYK (left) and the BTK repressor SH3BP5 (right) in the CTRL (green) and the ICF (blue) sample. DMRs (red bars) and CpG islands (black bars) are indicated.

References

    1. Portela A, Esteller M. Epigenetic modifications and human disease. Nat Biotechnol. 2010;28:1057–68. doi: 10.1038/nbt.1685. - DOI - PubMed
    1. Esteller M. Epigenetics in cancer. N Engl J Med. 2008;358:1148–59. doi: 10.1056/NEJMra072067. - DOI - PubMed
    1. Weber M, Hellmann I, Stadler MB, Ramos L, Pääbo S, Rebhan M, et al. Distribution, silencing potential and evolutionary impact of promoter DNA methylation in the human genome. Nat Genet. 2007;39:457–66. doi: 10.1038/ng1990. - DOI - PubMed
    1. Li E, Bestor TH, Jaenisch R. Targeted mutation of the DNA methyltransferase gene results in embryonic lethality. Cell. 1992;69:915–26. doi: 10.1016/0092-8674(92)90611-F. - DOI - PubMed
    1. Xu GL, Bestor TH, Bourc’his D, Hsieh CL, Tommerup N, Bugge M, et al. Chromosome instability and immunodeficiency syndrome caused by mutations in a DNA methyltransferase gene. Nature. 1999;402:187–91. doi: 10.1038/46214. - DOI - PubMed

Publication types

MeSH terms

Supplementary concepts