. 2012 Sep;61(9):2238-47.
doi: 10.2337/db11-1274. Epub 2012 May 17.

Identification of adipose tissue dendritic cells correlated with obesity-associated insulin-resistance and inducing Th17 responses in mice and patients

Affiliations

Identification of adipose tissue dendritic cells correlated with obesity-associated insulin-resistance and inducing Th17 responses in mice and patients

Adeline Bertola et al. Diabetes. 2012 Sep.

Abstract

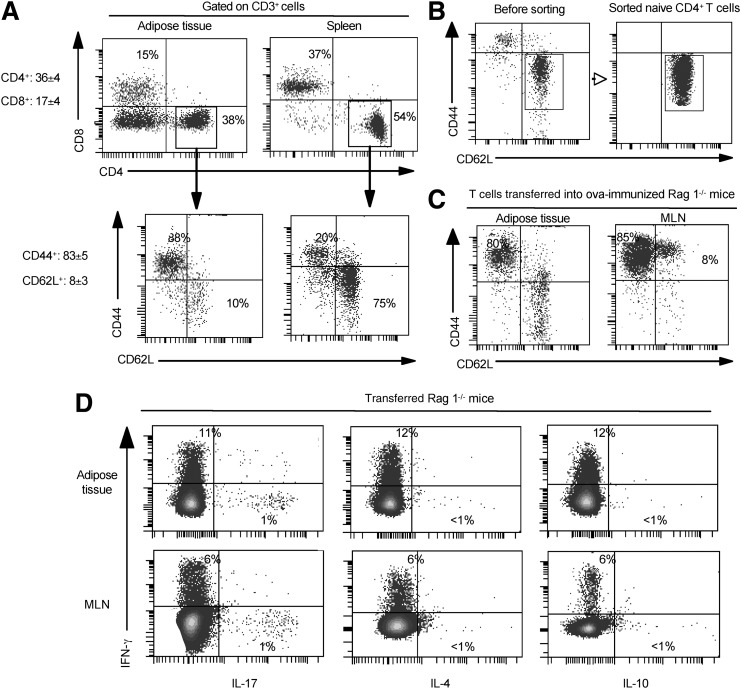
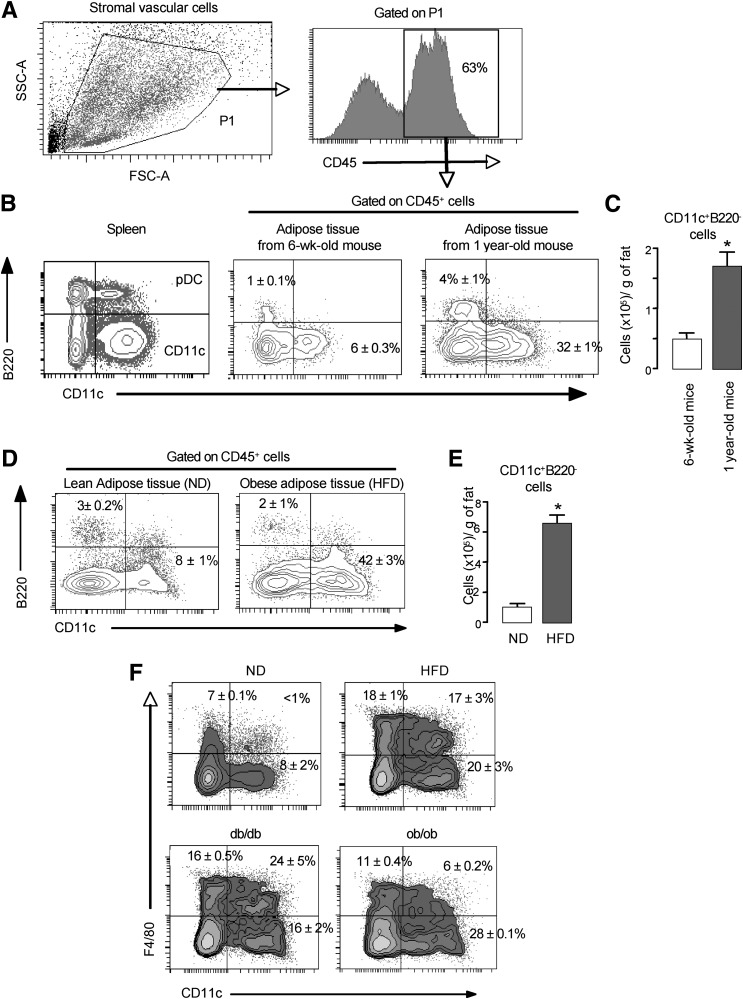
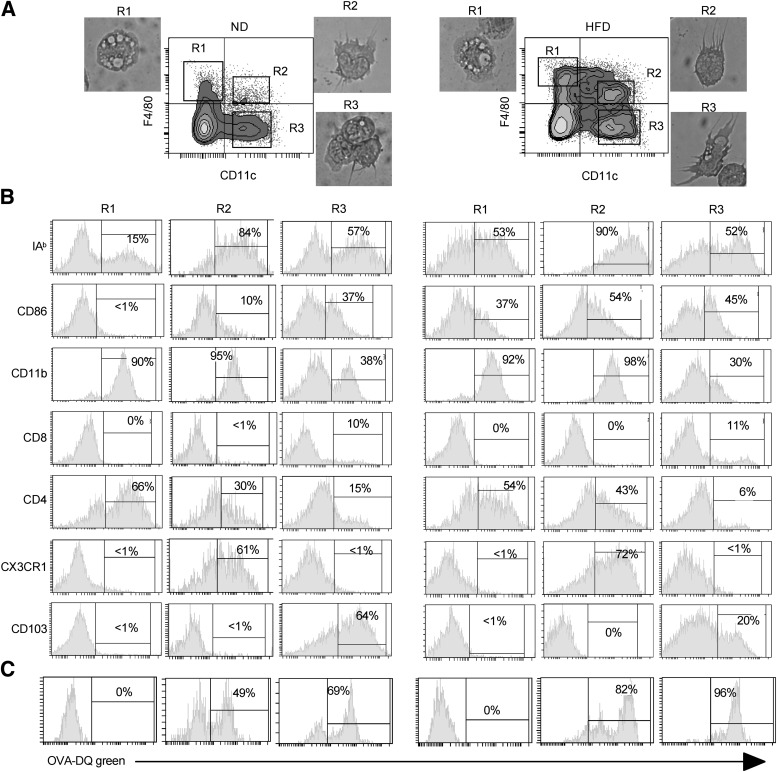
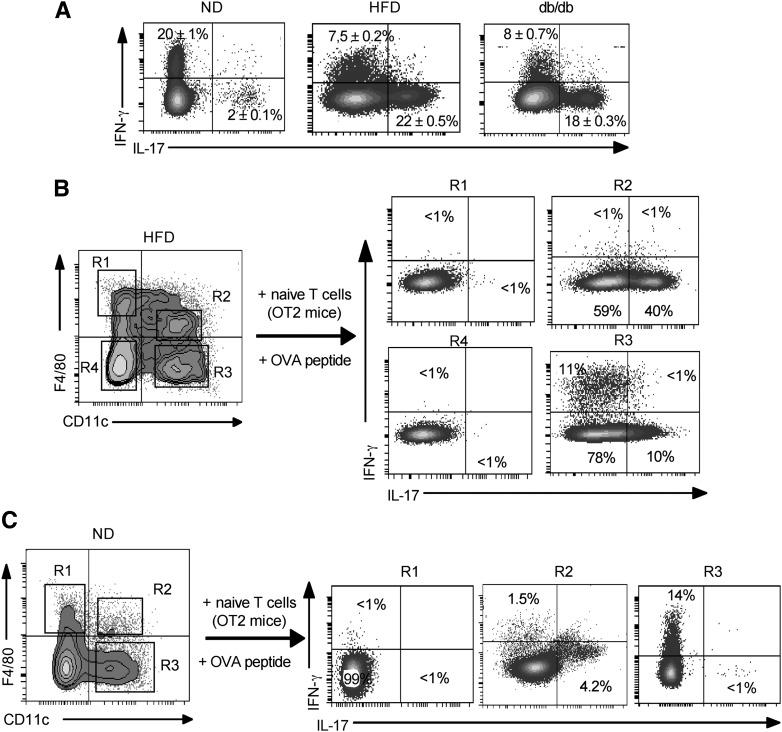
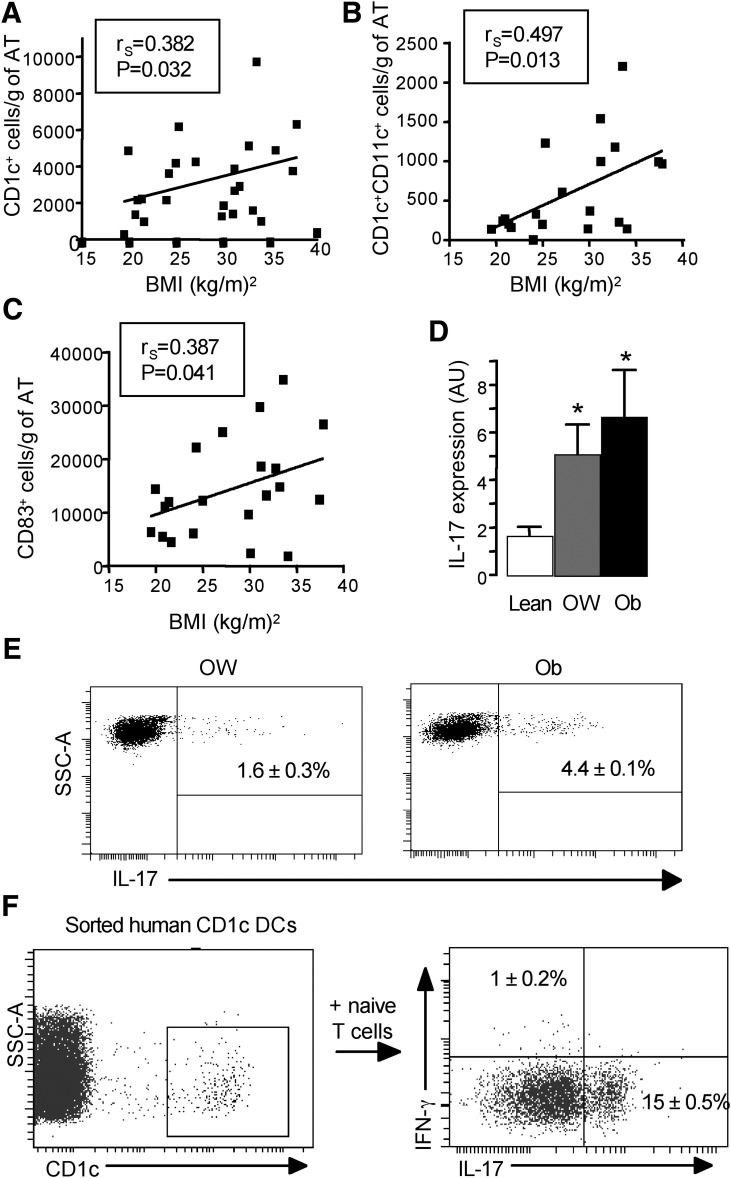
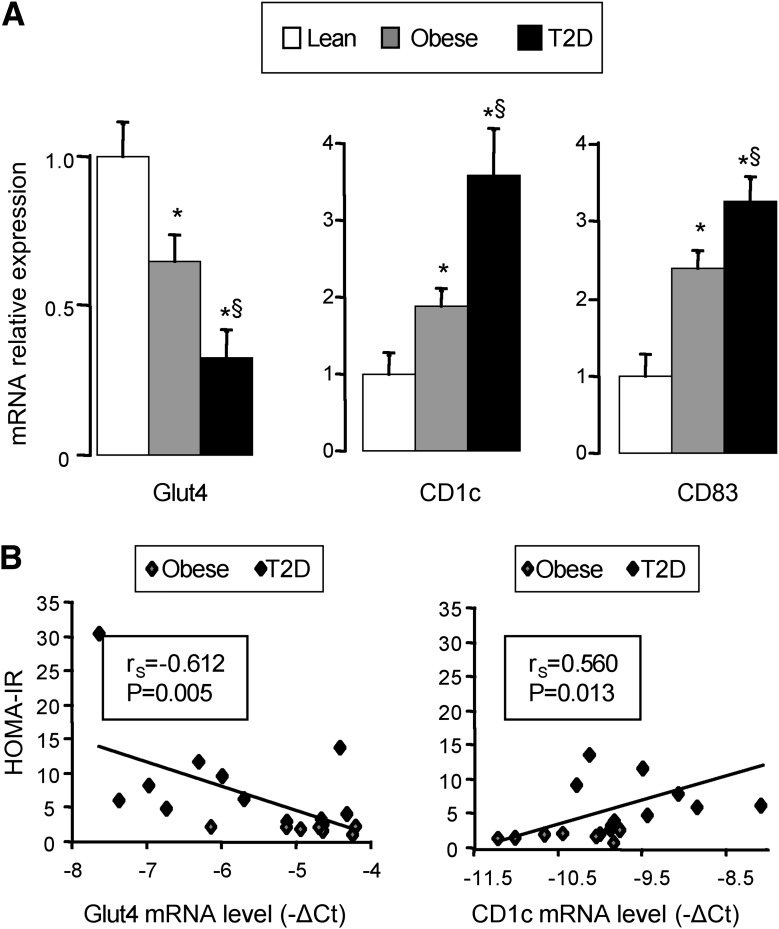
T-cell regulation in adipose tissue provides a link between inflammation and insulin resistance. Because of alterations in adipose tissue T-cell composition in obesity, we aimed to identify the antigen-presenting cells in adipose tissue of obese mice and patients with insulin resistance. Dendritic cells (DCs) and T cells were studied in mice and in two cohorts of obese patients. In lean mice, only CD11c(+) DCs were detected in adipose tissue. Adoptive transfer of naive CD4(+) T cells in Rag1(-/-) mice led to a predominant Th1 response in adipose tissue. In contrast, during obesity DCs (human CD11c(+)CD1c(+) and mouse CD11c(high)F4/80(low)) accumulated in adipose tissue. CD11c(high)F4/80(low) DCs from obese mice induced Th17 differentiation. In patients, the presence of CD11c(+)CD1c(+) DCs correlated with the BMI and with an elevation in Th17 cells. In addition, these DCs led to ex vivo Th17 differentiation. CD1c gene expression further correlated with homeostatic model assessment-insulin resistance in the subcutaneous adipose tissue of obese patients. We show for the first time the presence and accumulation of specific DCs in adipose tissue in mouse and human obesity. These DCs were functional and could be important regulators of adipose tissue inflammation by regulating the switch toward Th17 cell responses in obesity-associated insulin resistance.


Figures

FIG. 1.
FIG. 1.
Phenotype of fat-associated CD4+ T cells and homing of naive T cells into AT. A: Epididymal fat pads as well as the spleen were isolated from lean C57BL/6 mice, and the SVF was stained for CD3, CD4, CD8, CD44, and CD62 L. Results are representative of 7 experiments. B: Naive OVA-specific CD4+ T cells were isolated from the spleen of OT2 mice, were FACS-sorted based on CD62L+CD44 expression, and 106 cells were transferred into Rag1−/− mice immunized previously intraperitoneally with 50 μg of OVA protein. C: Phenotypic analysis of transferred naive OVA-specific CD4+ T cells, after 1 week, in mesenteric lymph nodes (MLN) and in AT. D: Cytokine profiles of activated T cells by intracytoplasmic analysis for IL-4, IL-10, IL-17, and IFN-γ. The results of 3 independent experiments are shown.
FIG. 2.
FIG. 2.
Characterization of DCs in AT from lean and obese mice. Epididymal fat pads as well as spleen were isolated from young (6 weeks old), old (1 year old), ND, HFD, ob/ob, and db/db mice, and the SVF was stained for CD45, CD11c, and B220. Cells were gated on CD45+ cells as indicated (A). B: Flow cytometric analysis of CD11c and B220 on the SVF CD45+ cells from epididymal fat tissue of young (6 weeks old) and old (1 year old) mice. C: The numbers of CD11c+ cells were calculated from FACS data and the SVF cell counts and expressed per gram of epididymal fat tissue. D: Flow cytometric analysis of CD11c and B220 on the SVF CD45+ cells from epididymal fat tissue of ND and HFD mice. E: The number of CD11c+ cells was calculated from FACS data and the SVF cell counts and expressed per gram of epididymal fat tissue. F: Flow cytometric analysis of CD11c and F4/80 on B220 on the SVF CD45+ cells from epididymal fat tissue of ND, HFD, db/db, and ob/ob mice. A representative result of 5 independent experiments with 5 mice per group and with similar results is shown. *P < 0.05. SSC-A, side scatter-aire; FSC-A, forward scatter-aire.
FIG. 3.
FIG. 3.
Identification of atypical CD11chigh F4/80low DCs. A: Sorted cell populations based on the expression of CD11c and F4/80 on B220 on the SVF CD45+ cells from epididymal fat tissue of ND and HFD mice, as indicated, were cytocentrifuged and stained with May-Grünwald-Giemsa. B: Phenotypic analysis by flow cytometry of AT DCs gated on CD45+ cells, from lean C57BL/6 and HFD mice, was performed by triple immunofluorescent staining after gating of different cell populations as indicated in A. C: Sorted cell populations were incubated with OVA-DQ, and 2 h later the cells were analyzed for the uptake and processing of DQ by flow cytometry. OVA-DQ fluoresced green when processed in acidified lysosomes. A representative result of 3 independent experiments with 5 mice per group and with similar results is shown.
FIG. 4.
FIG. 4.
CD11chigh F4/80low CX3CR1pos DCs induce Th17 differentiation in vitro. A: Analysis of cytokine expression of fat pad–associated CD4+ T cells of lean and obese mice by intracellular cytokine assay. B and C: 2 × 10⁵ naive OVA-specific CD4+ T cells were differentiated for two rounds of 5 days of stimulation with 5 × 10⁴ sorted cells from the SVF of lean and obese mice as indicated. After 2 weeks, T cells were collected, stimulated, and stained for intracellular cytokine assay using specific antibodies as indicated. The experiment was repeated three times with similar results.
FIG. 5.
FIG. 5.
Characterization of human dendritic cells and the expression level of IL-17 in purified T cells as a function of the BMI. FACS analyses were performed on total SVF (patient age = 44.6 ± 2.5 years, BMI ranging from 19.5 to 38 kg/m2, n = 20 to 24). A: Cell number of CD1c+ cells per gram of AT (P < 0.05, Spearman r = 0.3826, n = 24). B: Cell number of CD1c+ CD11c+ cells per gram of AT (P < 0.05, Spearman r = 0.4947, n = 20). C: Cell number of CD83+ cells per gram of AT (P < 0.05, Spearman r = 0.3870, n = 21). D: The gene expression level of IL-17 was evaluated by real-time PCR on immunoselected CD3+ T cells of the AT SVF of lean (n = 10 to 12), overweight (OW; n = 6 to 7), and obese (Ob; n = 12 to 14) patients. Results are means ± SEM. *P < 0.05. E: Intracellular cytokine analysis for IL-17 on immunoselected CD3+ T lymphocytes of the AT SVF of OW (n = 6 to 7) and Ob (n = 12 to 14) patients. F: Allogeneic CD4+ T cells purified from blood of healthy donors (n = 3) were cultured for 6 days with sorted CD1c+ DCs from the CD19CD14 cells of the SVF of obese patients (n = 3). CD4+ T cells were collected, stimulated, and stained for intracellular IL-17 and IFN-γ cytokines. The experiment was repeated three times with similar results. SSC-A, side scatter-aire; AU, arbitrary unit.
FIG. 6.
FIG. 6.
Glut4, CD1c, and CD83 expression in subcutaneous AT in lean and morbidly obese patients without or with type 2 diabetes (T2D). A: Glut4, CD1c, and CD83 mRNA expression was analyzed by real-time quantitative PCR in subcutaneous AT obtained from lean subjects (Lean; n = 4), morbidly obese patients without type 2 diabetes (obese; n = 10), and morbidly obese patients with type 2 diabetes (T2D; n = 10). Data are presented as relative mRNA normalized to RPLP0 mRNA and are expressed as means ± SEM. *P < 0.05 compared with lean; §P < 0.05 compared with obese patients without type 2 diabetes. B: Correlation between HOMA-IR and Glut4 or CD1c mRNA expression levels (−ΔCt) was analyzed using the Spearman’s rank correlation test for morbidly obese patients (n = 19).

References

    1. Neuschwander-Tetri BA, Caldwell SH. Nonalcoholic steatohepatitis: summary of an AASLD Single Topic Conference. Hepatology 2003;37:1202–1219 - PubMed
    1. Hanson RL, Imperatore G, Bennett PH, Knowler WC. Components of the “metabolic syndrome” and incidence of type 2 diabetes. Diabetes 2002;51:3120–3127 - PubMed
    1. Pradhan AD, Manson JE, Rifai N, Buring JE, Ridker PM. C-reactive protein, interleukin 6, and risk of developing type 2 diabetes mellitus. JAMA 2001;286:327–334 - PubMed
    1. Xu H, Barnes GT, Yang Q, et al. Chronic inflammation in fat plays a crucial role in the development of obesity-related insulin resistance. J Clin Invest 2003;112:1821–1830 - PMC - PubMed
    1. Harkins JM, Moustaid-Moussa N, Chung YJ, et al. Expression of interleukin-6 is greater in preadipocytes than in adipocytes of 3T3-L1 cells and C57BL/6J and ob/ob mice. J Nutr 2004;134:2673–2677 - PubMed

Publication types