Comparative Study
. 2012 Jun 29;53(7):4069-75.
doi: 10.1167/iovs.12-9438.

Automated quantification of volumetric optic disc swelling in papilledema using spectral-domain optical coherence tomography

Affiliations
Comparative Study

Automated quantification of volumetric optic disc swelling in papilledema using spectral-domain optical coherence tomography

Jui-Kai Wang et al. Invest Ophthalmol Vis Sci. .

Abstract

Purpose: To develop an automated method for the quantification of volumetric optic disc swelling in papilledema subjects using spectral-domain optical coherence tomography (SD-OCT) and to determine the extent that such volumetric measurements correlate with Frisén scale grades (from fundus photographs) and two-dimensional (2-D) peripapillary retinal nerve fiber layer (RNFL) and total retinal (TR) thickness measurements from SD-OCT.

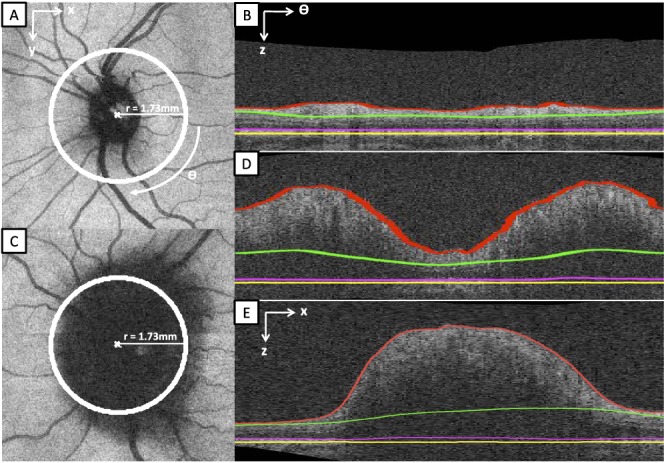
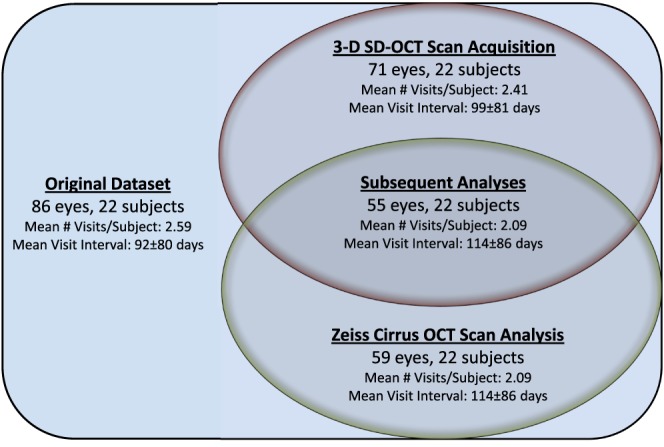
Methods: A custom image-analysis algorithm was developed to obtain peripapillary circular RNFL thickness, TR thickness, and TR volume measurements from SD-OCT volumes of subjects with papilledema. In addition, peripapillary RNFL thickness measures from the commercially available Zeiss SD-OCT machine were obtained. Expert Frisén scale grades were independently obtained from corresponding fundus photographs.

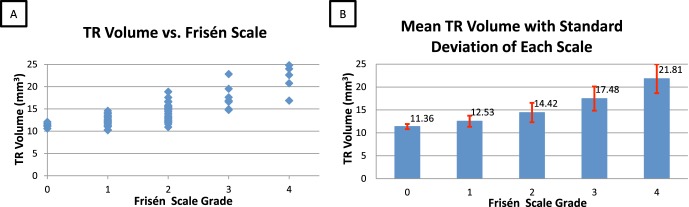
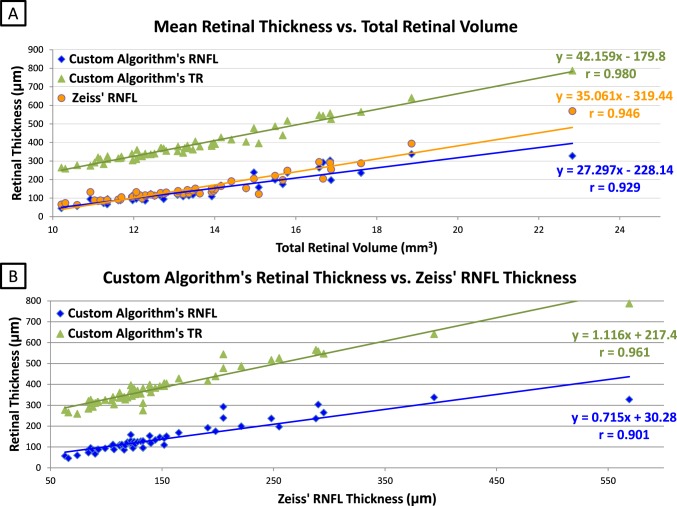
Results: In 71 SD-OCT scans, the mean (± standard deviation) resulting TR volumes for Frisén scale 0 to scale 4 were 11.36 ± 0.56, 12.53 ± 1.21, 14.42 ± 2.11, 17.48 ± 2.63, and 21.81 ± 3.16 mm(3), respectively. The Spearman's rank correlation coefficient was 0.737. Using 55 eyes with valid Zeiss RNFL measurements, Pearson's correlation coefficient (r) between the TR volume and the custom algorithm's TR thickness, the custom algorithm's RNFL thickness, and Zeiss' RNFL thickness was 0.980, 0.929, and 0.946, respectively. Between Zeiss' RNFL and the custom algorithm's RNFL, and the study's TR thickness, r was 0.901 and 0.961, respectively.

Conclusions: Volumetric measurements of the degree of disc swelling in subjects with papilledema can be obtained from SD-OCT volumes, with the mean volume appearing to be roughly linearly related to the Frisén scale grade. Using such an approach can provide a more continuous, objective, and robust means for assessing the degree of disc swelling compared with presently available approaches.


Conflict of interest statement

Disclosure: J.-K. Wang, None; R.H. Kardon, None; M.J. Kupersmith, None; M.K. Garvin, P

Figures

Figure 1.
Figure 1.
A composite example of papilledema cases of increasing Frisén scales (from scale 0 to scale 4, shown as subscript) with their corresponding retina-optic nerve volumes derived from the 3-D OCT scans. (A) A B-scan of the original SD-OCT volume. (B) Flattening and layer segmentation, where the red surface is ILM and the yellow surface, which is the reference surface of the flattening, is the lower bounding surface of the RPE complex. (C) The 3-D visualization of the entire SD-OCT volume. (D) The thickness map between red and yellow surfaces. (E) The corresponding fundus image. Note that figures here are displayed using a right-eye orientation/format.
Figure 2.
Figure 2.
The position of the circular scan (as same as the commercial Zeiss OCT machine) and its layer segmentation in two SD-OCT volumes. (A) The position of the circular scan (the white circle) on a normal projection image. (B) The 3-D layer segmentation of the unwrapped circular scan of (A). (C) The position of the circular scan on a projection image with severe papilledema (Frisén scale grade of 4). (D) The 3-D layer segmentation of the unwrapped circular scan of (C). (E) One B-scan of the same SD-OCT volume of (C), showing a sagittal cross-section through the center of the optic disc. The segmentation of the ILM border is depicted by the red line; the deeper, outer border of the RNFL by the green line; the photoreceptor boundary by the magenta line; and the retinal pigmented epithelial border by the yellow line. In the region underlying the ONH (E), the borders were extrapolated using a spline fit.
Figure 3.
Figure 3.
A Venn diagram showing the data used in the study's experiments. The original dataset included 86 SD-OCT volumes and fundus photographs from 22 subjects. The exclusion of 15 volumetric scans (due to an incompletely acquired ILM or RPE in the confines of the z-axis window) resulted in 71 volumetric SD-OCT volumes and fundus photographs from 22 subjects (indicated in red). This dataset was used for the first part of the study analyses. From the original dataset, the exclusion of 27 SD-OCT volumes due to the obvious failure of the SD-OCT scanner RNFL algorithm resulted in 59 volumetric SD-OCT volumes and fundus photographs from 22 subjects (indicated in green). This dataset was not directly used in the study analyses. The intersection of these two datasets (labeled “Subsequent Analyses”) resulted in 55 SD-OCT volumes and fundus photographs from 22 subjects. This dataset was used for the remaining analyses. For each dataset, the mean number of visits per subject and mean time interval (± standard deviation) between visits is also shown.
Figure 4.
Figure 4.
Papilledema grading differences in 71 eyes. (A) The scatter of TR volume versus Frisén scale. (B) The mean TR volumes with standard deviations of each Frisén scale.
Figure 5.
Figure 5.
Measurement correlations between total retinal-disc volume and peripapillary RNFL and TR thickness in 55 valid eyes.* (A) Compares the study's RNFL, Zeiss RNFL, and the study's TR thickness measurements with the TR volume measurement. (B) Compares the relationship between study approaches (including RNFL and TR thickness) and the Zeiss algorithm. * Valid eyes included were those in which the proprietary Zeiss algorithm for determining RNFL thickness did not fail and those where the volume scans were not truncated during acquisition (labeled “Subsequent Analyses” in Table 1 and Fig. 3). In addition to the Zeiss algorithm for determining RNFL, the TR volume, peripapillary retinal thickness (all retinal layers included), and peripapillary RNFL were determined using internally developed algorithms.

References

    1. Frisén L. Swelling of the optic nerve head: a staging scheme. J Neurol Neurosurg Psychiatry. 1982;4513–18 - PMC - PubMed
    1. Huang D, Swanson EA, Lin CP, et al. Optical coherence tomography. Science. 1991;254:1178–1181 - PMC - PubMed
    1. Karam EZ, Hedges TR. Optical coherence tomography of the retinal nerve fibre layer in mild papilloedema and pseudopapilloedema. Br J Ophthalmol. 2005;89:294–298 - PMC - PubMed
    1. Savini G, Bellusci C, Carbonelli M, et al. Detection and quantification of retinal nerve fiber layer thickness in optic disc edema using stratus OCT. Arch Ophthalmol. 2006;124:1111–1117 - PubMed
    1. Rebolleda G, Muñoz-Negrete FJ. Follow-up of mild papilledema in idiopathic intracranial hypertension with optical coherence tomography. Invest Ophthalmol Vis Sci. 2009;50:5197–5200 - PubMed

Publication types