. 2012 Jul 6;337(6090):64-9.
doi: 10.1126/science.1219240. Epub 2012 May 17.

Evolution and functional impact of rare coding variation from deep sequencing of human exomes

Affiliations

Evolution and functional impact of rare coding variation from deep sequencing of human exomes

Jacob A Tennessen et al. Science. .

Abstract

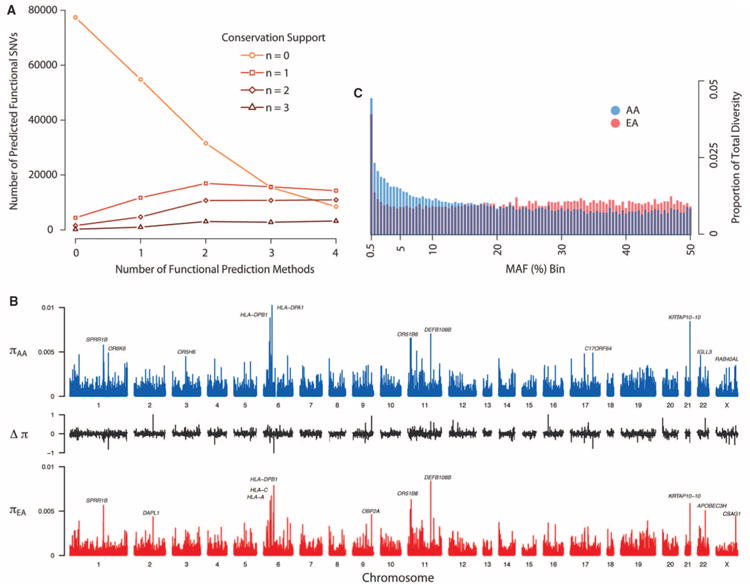
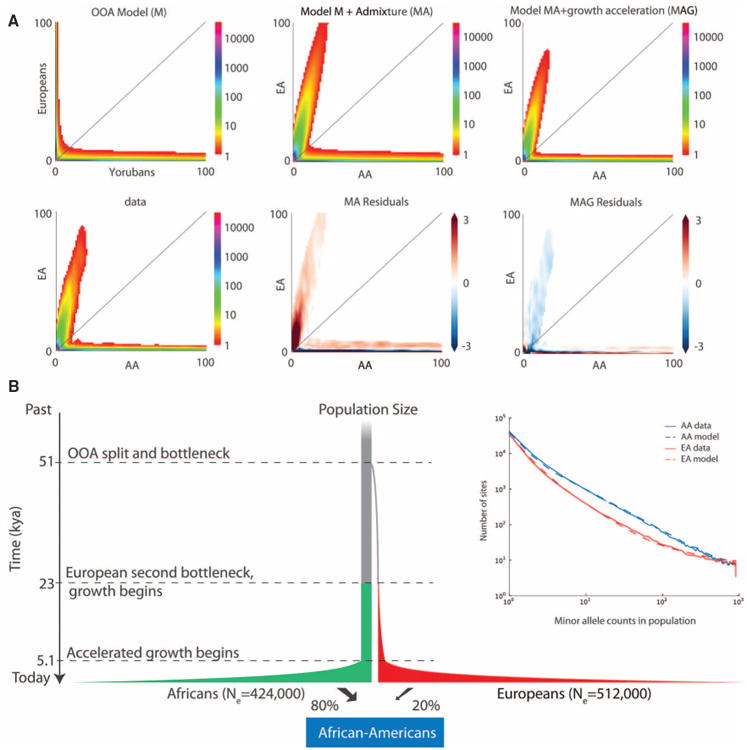
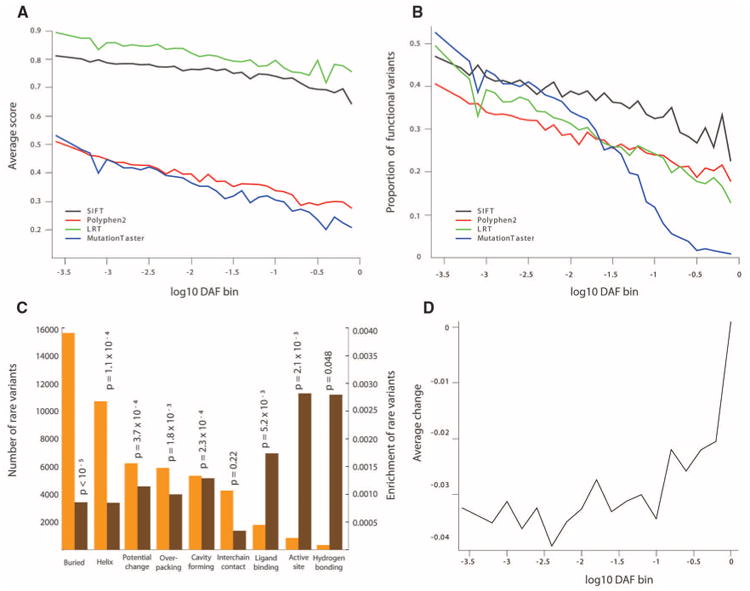
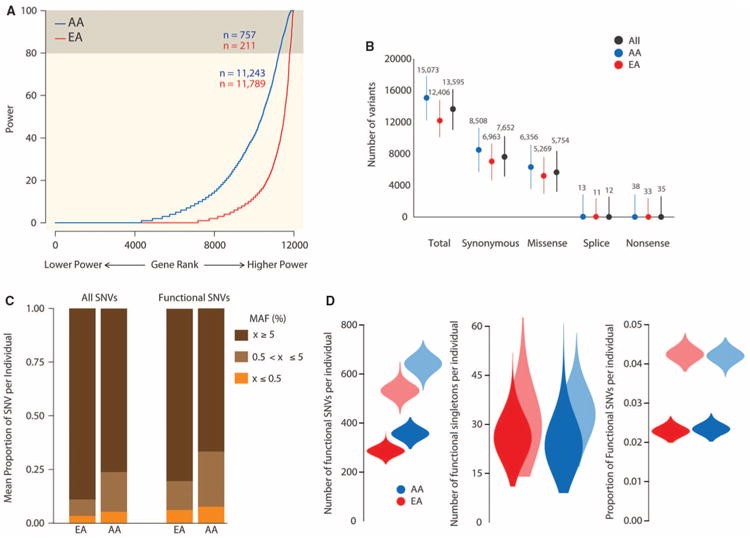
As a first step toward understanding how rare variants contribute to risk for complex diseases, we sequenced 15,585 human protein-coding genes to an average median depth of 111× in 2440 individuals of European (n = 1351) and African (n = 1088) ancestry. We identified over 500,000 single-nucleotide variants (SNVs), the majority of which were rare (86% with a minor allele frequency less than 0.5%), previously unknown (82%), and population-specific (82%). On average, 2.3% of the 13,595 SNVs each person carried were predicted to affect protein function of ~313 genes per genome, and ~95.7% of SNVs predicted to be functionally important were rare. This excess of rare functional variants is due to the combined effects of explosive, recent accelerated population growth and weak purifying selection. Furthermore, we show that large sample sizes will be required to associate rare variants with complex traits.


Figures

Fig. 1
Fig. 1
Characteristics of protein-coding variation in humans. (A) Number of nonsynonymous SNVs predicted to be functionally important as a function of seven different methods (18). (B) Distributions of π across the exome in AAs (blue) and EAs (red). The value of π for each gene is shown as a vertical line. The middle section shows the difference in diversity between EA and AA (Δπ = πEA − πAA), scaled between 0 and 1. (C) Distributions of the proportion of total diversity, π, attributable to SNVs with different MAFs in the EA and AA samples. The x axis is binned in increments of 0.5%.
Fig. 2
Fig. 2
Deep sequencing reveals increases of recent population size. (A) Joint SFS predicted from different demographic models (top) compared with the observed data (bottom), displaying allele counts between 0 and 100 chromosomes. The three models are (left) an OOA model without admixture derived from the 1000 Genomes data, (middle) the same model with the AA panel modeled as an 80%:20% admixture between African and European lineages, and (right) the same model further modified to account for recent growth acceleration. Anscombe residuals are displayed, with regions showing more variants than predicted by the model in blue and less in red. Bins with expected counts <1 are displayed as white in all graphs. (B) Schematic representation (not to scale) of the inferred demographic model and parameters (18). kya, thousand years ago. (Inset) Comparison of the observed SFS to that predicted by the demographic model incorporating recent accelerated growth.
Fig. 3
Fig. 3
Signatures of purifying selection in protein-coding SNVs. (A) Relationship between the evidence that a variant is functionally important and MAF for four different methods. (B) Relationship between the proportion of putatively functional variants and MAF for the same predictions as in (A). (C) Comparison of the number of rare SNVs (orange) and enrichmentofrareornon-synonymous SNVs (brown) located in different protein structural categories [P values were calculated by a permutation test (18)]. (D) Relationship between average change of w score of synonymous variants and DAF.
Fig. 4
Fig. 4
Power of rare variant association mapping and personal genomics characteristics of protein-coding SNVs. (A) Distribution of gene-specific estimates of power to map causal rare variants across 12,000 protein-coding genes with at least three SNVs in the EA (red) or AA (blue) samples. Power varied widely across loci, and <5% of genes (beige) achieve 80% power even when relatively strong effects (OR = 5) are modeled. (B) Average number (points) and range (vertical lines) of synonymous, missense, splice site, and nonsense SNVs. (C) Average proportion of SNVs per individual that are rare (MAF ≤ 0.5%), intermediate (0.5% < MAF < 5%), or common (MAF ≥ 5%) in the population from which they were sampled. The proportions of rare and intermediate frequency variants per individual are significantly higher (Wilcoxon-rank sum test; P < 10−15) for putatively functional SNVs. (D) Violin plots showing the distribution of number of functional SNVs, number of functional singletons, and proportion of functional SNVs per individual in the EA and AA samples. Darker and lighter shaded plots correspond to conservative and more liberal definitions of functional variation, respectively.

Comment in

References

    1. Bamshad MJ, et al. Nat Rev Genet. 2011;12:745. - PubMed
    1. Ajay SS, Parker SC, Abaan HO, Fajardo KV, Margulies EH. Genome Res. 2011;21:1498. - PMC - PubMed
    1. Sobreira NL, et al. PLoS Genet. 2010;6:e1000991. - PMC - PubMed
    1. International HapMap Consortium. Nature. 2005;437:1299. - PubMed
    1. Frazer KA, et al. Nature. 2007;449:851. - PMC - PubMed

Publication types