Review
. 2012 Jul;113(2):328-39.
doi: 10.1152/japplphysiol.00320.2012. Epub 2012 May 17.

Imaging lung perfusion

Affiliations
Review

Imaging lung perfusion

Susan R Hopkins et al. J Appl Physiol (1985). 2012 Jul.

Abstract

From the first measurements of the distribution of pulmonary blood flow using radioactive tracers by West and colleagues (J Clin Invest 40: 1-12, 1961) allowing gravitational differences in pulmonary blood flow to be described, the imaging of pulmonary blood flow has made considerable progress. The researcher employing modern imaging techniques now has the choice of several techniques, including magnetic resonance imaging (MRI), computerized tomography (CT), positron emission tomography (PET), and single photon emission computed tomography (SPECT). These techniques differ in several important ways: the resolution of the measurement, the type of contrast or tag used to image flow, and the amount of ionizing radiation associated with each measurement. In addition, the techniques vary in what is actually measured, whether it is capillary perfusion such as with PET and SPECT, or larger vessel information in addition to capillary perfusion such as with MRI and CT. Combined, these issues affect quantification and interpretation of data as well as the type of experiments possible using different techniques. The goal of this review is to give an overview of the techniques most commonly in use for physiological experiments along with the issues unique to each technique.


Figures

Fig. 1.
Fig. 1.
When measuring lung perfusion, especially with repeated examinations, the lung volume has to be taken into account. Left: contrast-enhanced MRI perfusion study of a healthy volunteer in full inspiratory breath hold, i.e., total lung capacity. Large vessels can easily be identified. Mean pulmonary blood volume (PBV) as computed by a dedicated software tool (PulmoMR, Fraunhofer MEVIS, Bremen) is ∼28.1 ml·100 ml−1 of lung. In expiration, i.e., residual volume, mean PBV rises to ∼62.9 ml·100 ml−1. Scale equals ml·100 ml−1. Courtesy of J. Ley-Zaporozhan, Toronto, and P. Kohlmann, Bremen.
Fig. 2.
Fig. 2.
A: occlusion of pulmonary vessels will lead to sharply delineated perfusion defects as in this case of acute pulmonary embolism of the left inferior lobe in the pulmonary perfusion MRI [maximum intensity projection (MIP) image]. Perfusion of the right lung remains unimpeded. B: in contrast, cystic fibrosis with its extensive mucus obstruction of airways goes along with large hypoperfused areas in both lungs (MIP). C: chronic obstructive pulmonary disease COPD with concomitant emphysema shows a generally lower degree of contrast enhancement as well as diffuse patchy perfusion defects predominantly of the superior lobes (MIP).
Fig. 3.
Fig. 3.
A: ASL-FAIRER MRI measurement of pulmonary blood flow in a single sagittal slice of the right lung in a healthy normal subject. A is the control (selective inversion) image. Apex of the lung is to the right of the images, the diaphragm is to the left. Liver is seen as the subdiaphragmatic structure in A and B. A phantom for absolute quantification is also seen in A and B. Blood that has not been tagged flows into the image plane and produces signal that is seen as both vascular structures and a blush to the lung periphery. B is the tag (nonselective inversion) image where the signal observed is to T1 recovery of longitudinal magnetization after the entire torso has experienced the inversion pulses, which is identical in both A and B. Subtraction of the tag and control images is seen in C, in which stationary signal is subtracted out and gives a map of protons that entered the image plane in A during one systolic ejection. Finally, filters are applied to remove contribution from larger conduit vessels (D) by eliminating voxels that are more than 35% of the maximum signal intensity, leaving largely perfusion information. Color scale is blood flow in ml·min−1·ml−1.
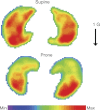
Fig. 4.
Fig. 4.
99mTc-MAA SPECT images of pulmonary perfusion in the axial plane of both lungs obtained from a healthy normal volunteer in prone and supine posture. Perfusion is increased in the dependent lung in both postures. In part this is due to gravitationally induced lung tissue deformation inside the thorax. [Figure modified with permission from (74).]

References

    1. Alford SK, van Beek EJ, McLennan G, Hoffman EA. Heterogeneity of pulmonary perfusion as a mechanistic image-based phenotype in emphysema susceptible smokers. Proc Natl Acad Sci USA 107: 7485–7490, 2010 - PMC - PubMed
    1. Almquist H, Jonson B, Palmer J, Valind S, Wollmer P. Regional VA/Q ratios in man using 133Xe and single photon emission computed tomography (SPECT) corrected for attenuation. Clin Physiol 19: 475–481, 1999 - PubMed
    1. Almquist HM, Palmer J, Jonson B, Wollmer P. Pulmonary perfusion and density gradients in healthy volunteers. J Nucl Med 38: 962–966, 1997 - PubMed
    1. Altemeier WA, McKinney S, Glenny RW. Fractal nature of regional ventilation distribution. J Appl Physiol 88: 1551–1557, 2000 - PubMed
    1. Amundsen T, Torheim G, Kvistad KA, Waage A, Bjermer L, Nordlid KK, Johnsen H, Asberg A, Haraldseth O. Perfusion abnormalities in pulmonary embolism studied with perfusion MRI and ventilation-perfusion scintigraphy: an intra-modality and inter-modality agreement study. J Magn Reson Imaging 15: 386–394, 2002 - PubMed

Publication types

LinkOut - more resources