Review
. 2012 Aug 15;113(4):636-46.
doi: 10.1152/japplphysiol.00372.2012. Epub 2012 May 17.

Airway imaging in disease: gimmick or useful tool?

Affiliations
Review

Airway imaging in disease: gimmick or useful tool?

Peter D Paré et al. J Appl Physiol (1985). .

Abstract

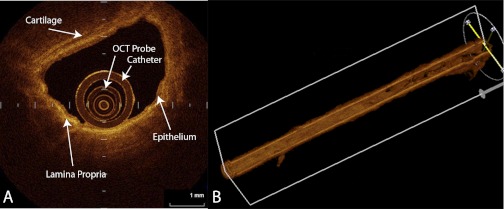
Airway remodeling is an important pathophysiological mechanism in a variety of chronic airway diseases. Historically investigators have had to use invasive techniques such as histological examination of excised tissue to study airway wall structure. The last several years has seen a proliferation of relatively noninvasive techniques to assess the airway branching pattern, wall thickness, and more recently, airway wall tissue components. These methods include computed tomography, magnetic resonance imaging, and optical coherence tomography. These new imaging technologies have become popular because to understand the physiology of lung disease it is important we understand the underlying anatomy. However, these new approaches are not standardized or available in all centers so a review of their validity and clinical utility is appropriate. This review documents how investigators are working hard to correct for inconsistencies between techniques so that they become more accepted and utilized in clinical settings. These new imaging techniques are very likely to play a frontline role in the study of lung disease and will, hopefully, allow clinicians and investigators to better understand disease pathogenesis and to design and assess new therapeutic interventions.


Figures

Fig. 1.
Fig. 1.
Three separate airways (A–C, E–F, G–I) that have been compared using hematoxylin and eosin-stained histology (A, D, G), gross pathology (B, E, H), and computed tomography (CT; C, F, I). Airway A–C is larger than airway E–F, which is larger than airway G–I. Airways were identified and matched by comparing the cut surface of gross pathology lung slices to the CT images and matching for as many anatomic landmarks as possible. Dotted lines on the images show where the measurements of lumen area and wall area were made. Dotted line on the CT image was produced using the CT analysis algorithm (full width at half maximum). Scale bar represents 0.5 mm. Wall area on the CT appears blurred because of magnification and the display parameters (window width and level) that were chosen but is also indicative of the lesser spatial resolution of the CT images.
Fig. 2.
Fig. 2.
A schematic of a cross-sectioned airway and blood vessel showing the measurements that were made. Pi, internal perimeter; Po, external perimeter; Ai, luminal area; Aaw, airway wall area. If an airway abutted a blood vessel the thickness of the airway wall was maintained over the area of contact as illustrated by the dotted line.
Fig. 3.
Fig. 3.
A: Bland and Altman plot of the mean airway lumen area (Ai in mm2) measured histologically vs. the difference between the CT measurements and the histological measurements (Ai CT − Ai micro in mm2). B: Bland and Altman plot of the mean airway wall area (Aaw − mm2) measured histologically vs. the difference between CT and histology measurements (Awa CT − Awa micro mm2) in B. Horizontal solid line represents the mean difference between CT and histology while the interrupted line indicates plus and minus two standard deviations of the difference. Line of best fit for the data is also included and is almost identical to the mean difference line.
Fig. 4.
Fig. 4.
This figure shows a screen capture of an analysis of the airway tree using a multi-detector row CT scan and commercially available CT analysis software. These CT scans can be used to segment the airway tree and analyze the airway dimensions at any location. A 3-dimensional reconstruction of the airway tree is shown in A with the airway path of interest highlighted in green. B: longitudinal section of a reformatted airway path from A. Yellow cross on the airway in B is at the location of the small “CT view” on A. C: transverse original CT image at the level of the yellow cross in B. D: reformatted CT scan image at the cross section to the airway centerline. E: internal view of the airway lumen at the level of the yellow cross. Measurements of airway dimensions are automated for each segment of the airway tree at the mid-point between 2 branch points. (Images created using the Apollo image analysis software from VIDA Diagnostics, Coralville, IA.)
Fig. 5.
Fig. 5.
Optical coherence tomography (OCT) images of a medium-sized airway in cross-section (A) and reconstructed 3-dimensional airway obtained by a “pull back technique” where the OCT probe is retracted 5 cm up the airway during scanning (B). OCT probe and surrounding catheter can be seen in lumen of A. A also shows the bright contrast pattern of the lamina propria and the less contrast of the epithelial layer and the cartilage. The pull back technique produces images of an airway path while the OCT probe is automatically retracted 5 cm. Images are obtained in a “helical” method and can be reconstructed into the 3-dimensional image of the airway path. (Images courtesy of Dr. Keishi Ohtani, BC Cancer Research Centre, Vancouver, BC, and Department of Surgery, Tokyo Medical University, Tokyo, Japan).

Similar articles

Cited by

References

    1. Aldrich JE, Bilawich AM, Mayo JR. Radiation doses to patients receiving computed tomography examinations in British Columbia. Can Assoc Radiol J 57: 79–85, 2006 - PubMed
    1. Armstrong JJ, Leigh MS, Sampson DD, Walsh JH, Hillman DR, Eastwood PR. Quantitative upper airway imaging with anatomic optical coherence tomography. Am J Respir Crit Care Med 173: 226–233, 2006 - PubMed
    1. Armstrong JJ, Leigh MS, Walton ID, Zvyagin AV, Alexandrov SA, Schwer S, Sampson DD. In vivo size and shape measurement of the human upper airway using endoscopic long-range optical coherence tomography. Optics Express 2003: 1817–1826, 2003 - PubMed
    1. Bankier AA, Fleischmann D, Mallek R, Windisch A, Winkelbauer FW, Kontrus M, Havelec L, Herold CJ, Hubsch P. Bronchial wall thickness: Appropriate window settings for thin-section CT and radiologic-anatomic correlation. Radiology 199: 831–836, 1996 - PubMed
    1. Bateman ED, Hurd SS, Barnes PJ, Bousquet J, Drazen JM, FitzGerald M, Gibson P, Ohta K, O'Byrne P, Pedersen SE, Pizzichini E, Sullivan SD, Wenzel SE, Zar HJ. Global strategy for asthma management and prevention: GINA executive summary. Eur Respir J 31: 143–178, 2008 - PubMed

Publication types