. 2012 Dec 15;520(18):4168-83.
doi: 10.1002/cne.23145.

Neuroanatomy of melanocortin-4 receptor pathway in the lateral hypothalamic area

Affiliations

Neuroanatomy of melanocortin-4 receptor pathway in the lateral hypothalamic area

Huxing Cui et al. J Comp Neurol. .

Abstract

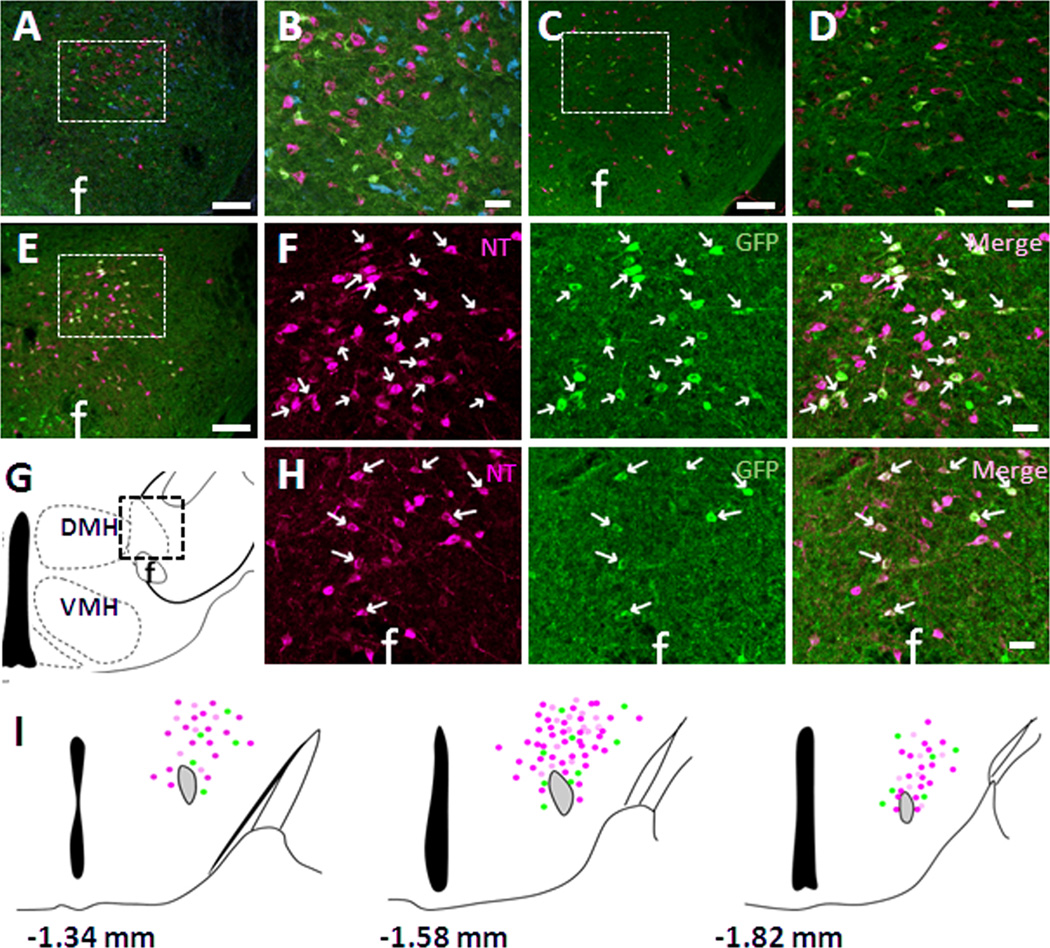
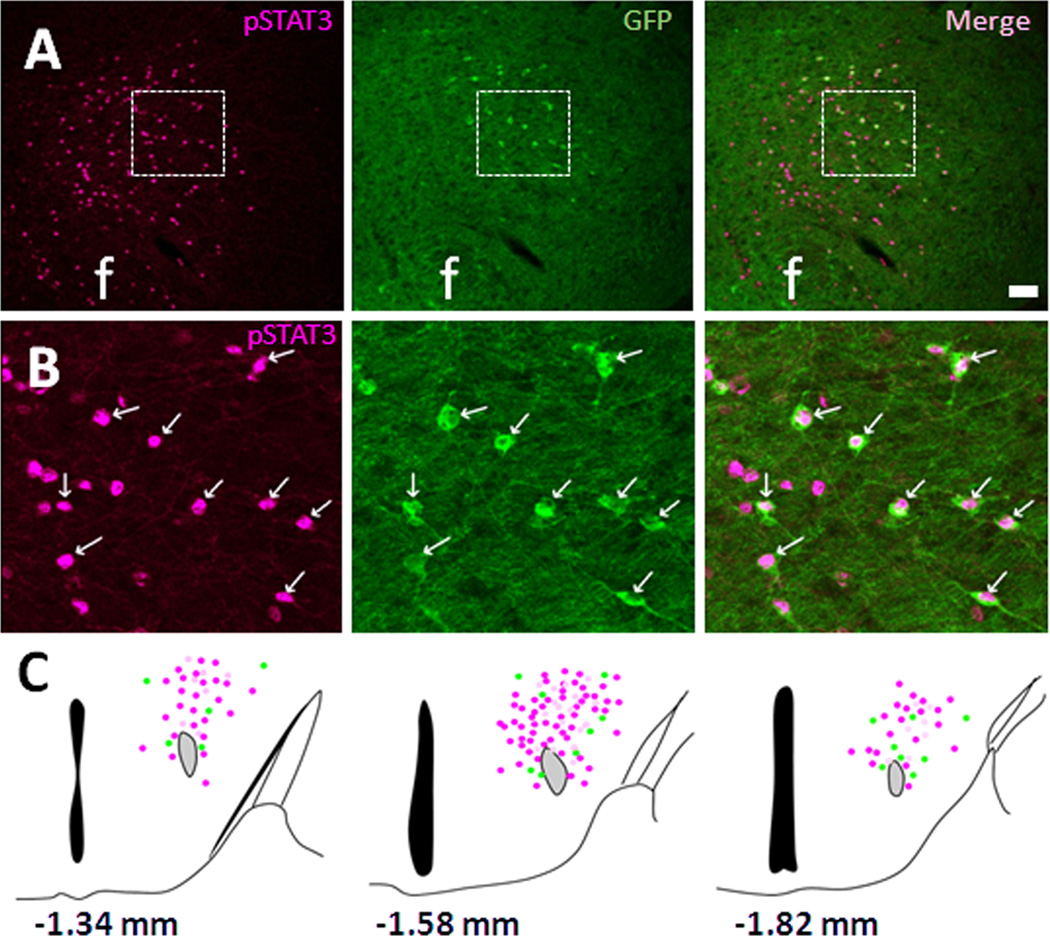
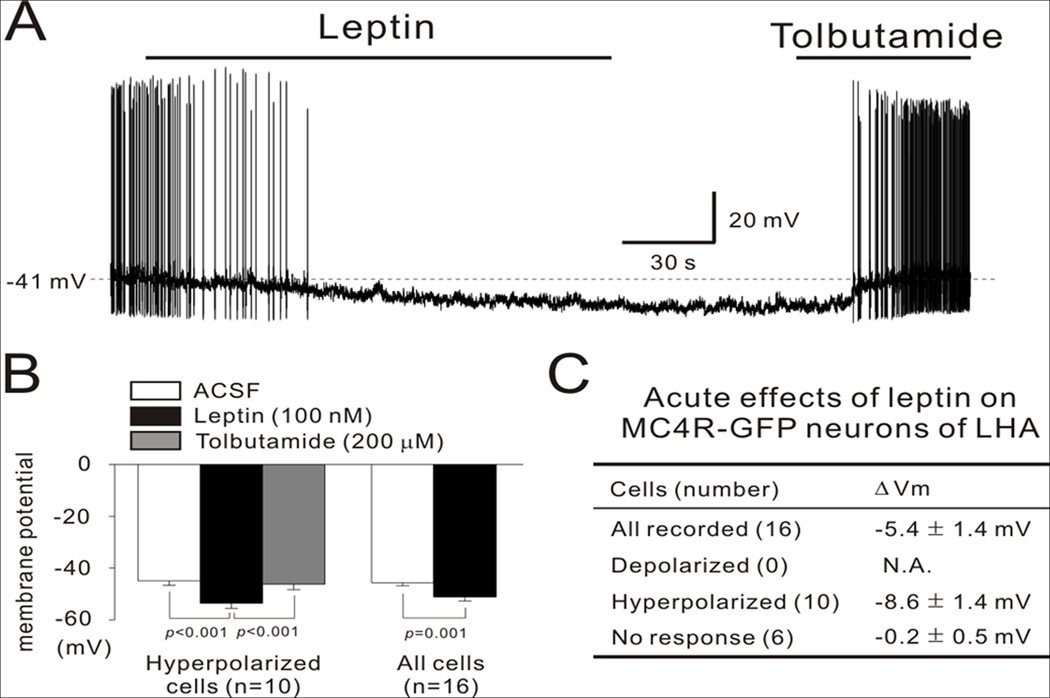
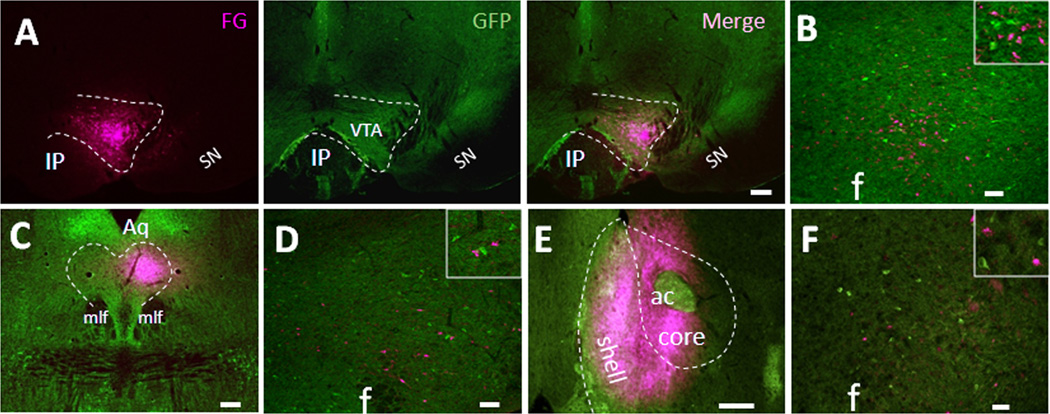
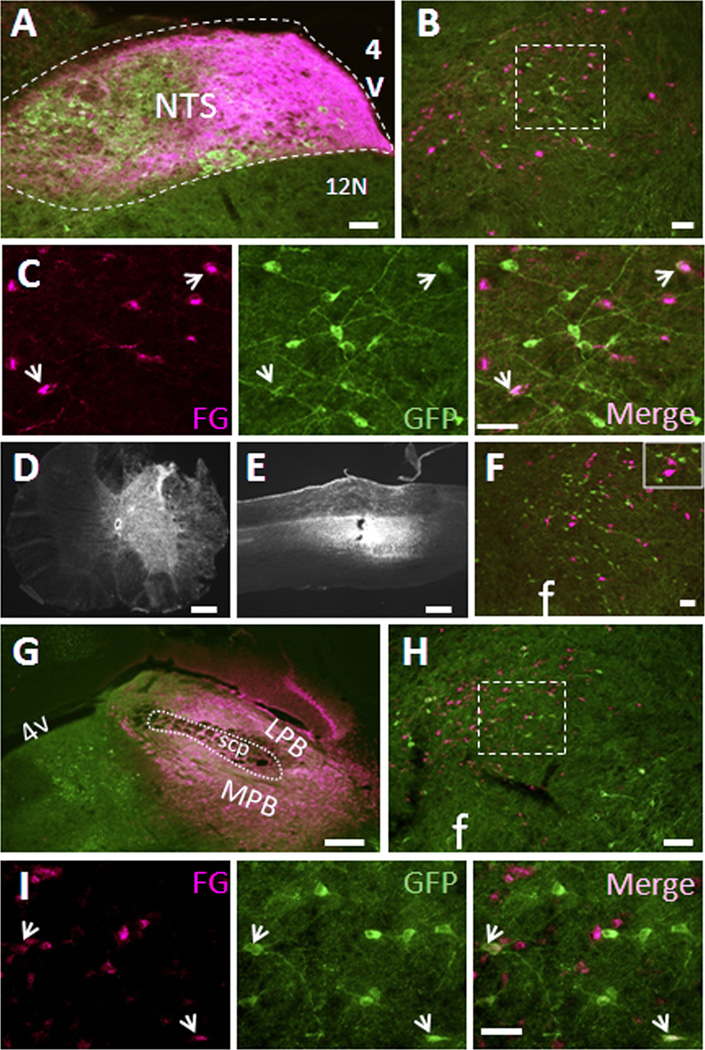
The central melanocortin system regulates body energy homeostasis including the melanocortin-4 receptor (MC4R). The lateral hypothalamic area (LHA) receives dense melanocortinergic inputs from the arcuate nucleus of the hypothalamus and regulates multiple processes including food intake, reward behaviors, and autonomic function. By using a mouse line in which green fluorescent protein (GFP) is expressed under control of the MC4R gene promoter, we systemically investigated MC4R signaling in the LHA by combining double immunohistochemistry, electrophysiology, and retrograde tracing techniques. We found that LHA MC4R-GFP neurons coexpress neurotensin as well as the leptin receptor but do not coexpress other peptide neurotransmitters found in the LHA including orexin, melanin-concentrating hormone, and nesfatin-1. Furthermore, electrophysiological recording demonstrated that leptin, but not the MC4R agonist melanotan II, hyperpolarizes the majority of LHA MC4R-GFP neurons in an ATP- sensitive potassium channel-dependent manner. Retrograde tracing revealed that LHA MC4R-GFP neurons do not project to the ventral tegmental area, dorsal raphe nucleus, nucleus accumbens, and spinal cord, and only limited number of neurons project to the nucleus of the solitary tract and parabrachial nucleus. Our findings provide new insights into MC4R signaling in the LHA and its potential implications in homeostatic regulation of body energy balance.


Conflict of interest statement

Conflict of Interest: None

Figures

Figure 1
Figure 1. Neurochemical phenotype of LHA MC4R-GFP neurons
Multiple fluorescent IHC in colchicine-treated MC4R-GFP mouse brain sections revealed that LHA MC4R-GFP neurons (green) were completely distinct from orexin (A, B, magenta), MCH (A, B, blue) and nesfatin-1 (C, D, magenta) but colocalized with NT (magenta) in both dorsal LHA (E, F) and perifornical area (G, H). B and D are digital zoom of boxed regions of A and B, respectively. F is digital zoom of boxed region of E shown by individual fluorescent signal channels. (I) Schematic drawing of distribution of NT (magenta), MC4R-GFP (green) and double-positive (white) cells in 3 different levels of the LHA. Note that actual expression of NT and MC4R-GFP cells in other hypothalamic nuclei is not presented here. f, fornix; DMH, dorsomedial hypothalamus; VMH, ventromedial hypothalamus. White arrows indicate representative colocalization. Scale bars: A, B, C, 120 um; A’, B’, C’, D’, 60 um.
Figure 2
Figure 2. Co-localization of MC4R-GFP neurons with leptin-induced pSTAT3
Double fluorescent IHC in ICV leptin-treated MC4R-GFP mouse brain sections revealed that leptin-induced pSTAT3 (magenta) and MC4R-GFP (green) are co-expressed in the mid-dorsal LHA (A). Digital zoom of boxed region in (A) is showed in (B). (C) Schematic drawing of distribution of pSTAT3 (magenta), MC4R-GFP (green) and double-positive (white) cells in 3 different levels of the LHA. Note that actual expression of NT and MC4R-GFP cells in other hypothalamic nuclei is not presented here. White arrows indicate representative co-localization. f, fornix; Scale bars: A, 80 um; B, 40 um.
Figure 3
Figure 3. Leptin hyperpolarizes LHA MC4R-GFP neurons via KATP channels
(A) Representative figure showing that bath application of leptin (100 nM) hyperpolarized the membrane potential of LHA MC4R-GFP neurons, which was completely reversed by the KATP channel blocker tolbutamide (200 uM). (B) In the hyperpolarized cell group, the average membrane potential (−44.9 ± 1.7 mV) was significantly hyperpolarized by leptin (−53.5 ± 2.0 mV) in 10 cells. This hyperpolarization was completely recovered by tolbutamide (−46.2 ± 2.2 mV). Leptin also had a significant hyperpolarizing effect on the average membrane potential of all recorded cells (from −45.7 ± 1.2 mV to −51.1 ± 1.6 mV in 16 cells). (C) This table summarizes the acute responses of MC4R-GFP neurons in the LHA to leptin. (D) Representative figure showing that bath application of MC4R agonist MTII had no effect on membrane potential of LHA MC4R-GFP neurons. Data are presented as mean ± S.E.M.
Figure 4
Figure 4. LHA MC4R-GFP neurons do not project to the ventral tegmental area, dorsal raphe and nucleus accumbens
Retrograde neuronal tracers were injected into the VTA, DR and NAc of MC4R-GFP mice and 5~7 days post-surgery, mice were perfused with 4% PFA and brain sections were processed for double fluorescent IHC for GFP and tracer. (A) Representative precise injection site of the VTA was shown by individual fluorescent channels. (B). Representative LHA double fluorescent IHC image from precise VTA-injected cases with retrograde tracer (magenta) and MC4R-GFP (green). Boxed region is digital zoom of the image. (C) Representative precise injection site of the DR. (D). Representative LHA double fluorescent IHC image from precise DR-injected cases with retrograde tracer (magenta) and MC4R-GFP (green). Boxed region is digital zoom of the image. (E) Representative precise injection site of the Nac. (F). Representative LHA double fluorescent IHC image from precise NAc-injected cases with retrograde tracer (magenta) and MC4R-GFP (green). Boxed region is digital zoom of the image. IP, interpeduncular nucleus; SN, substantia nigra; Aq, Aquaduct; mlf, medial longitudinal fasciculus; ac, anterior commissure; f, fornix. Scale bars: A and C, 240 um; B, D and F, 80 um; E, 320 um.
Figure 5
Figure 5. Limited numbers of LHA MC4R-GFP neurons project to the nucleus of solitary tract and the parabrachial nucleus but not spinal cord
Retrograde neuronal tracers were injected into the NTS, PBN and spinal cord of MC4R-GFP mice and 5~7 days post-surgery, mice were perfused with 4% PFA and brain sections were processed for double fluorescent IHC for GFP (green) and tracer (red). (A) Representative precise injection site of the NTS. (B). Representative LHA double fluorescent IHC image from precise NTS-injected cases with retrograde tracer (magenta) and MC4R-GFP (green). (C) Digital zoom of boxed region in (B) was shown by individual fluorescent channels. White arrows indicate colocalization. (D and E) Correct injection site of spinal cord was shown by coronal and sagittal sections, respectively. (F) Representative LHA double fluorescent IHC image from spinal cord-injected cases with retrograde tracer (magenta) and MC4R-GFP (green). Boxed region is digital zoom of the image. (G) Representative precise injection site of the PBN. (H). Representative LHA double fluorescent IHC image from precise PBN-injected cases with retrograde tracer (magenta) and MC4R-GFP (green). (I) Digital zoom of boxed region in (H) was shown by individual fluorescent channels. White arrows indicate colocalization. NTS, nucleus of solitary tract; 12N, hypoglossal nucleus; scp, superior cerebellar peduncle; LPB, lateral parabrachial nucleus; MPB, medial parabrachial nucleus; 4V, fourth ventricle; f, fornix. Scale bars: A, B, F and H, 80 um; C and I, 40 um; D, E and G, 320 um.
Figure 6
Figure 6. MTII- and leptin-induced c-Fos on orexin neurons
Representative images showing c-Fos expression (dark brown nuclei) within orexin neurons (brown soma) by saline, MTII and leptin. A–C, Mice received saline (A), MTII (B) and leptin (C) at ZT6 and killed 2 hours later (ZT8). D, E and F are digital zoom in of A, B and C, respectively. G–I, Mice received saline (G), MTII (H) and leptin (I) at ZT18 and killed 2 hours latter (ZT20). J, K and L are digital zoom in of G, H and I, respectively. Scale bar: 80 um.

Similar articles

Cited by

References

    1. Al-Khater KM, Kerr R, Todd AJ. A quantitative study of spinothalamic neurons in laminae I, III, and IV in lumbar and cervical segments of the rat spinal cord. J Comp Neurol. 2008;511(1):1–18. - PMC - PubMed
    1. Bagnol D, Lu XY, Kaelin CB, Day HE, Ollmann M, Gantz I, Akil H, Barsh GS, Watson SJ. Anatomy of an endogenous antagonist: relationship between Agouti-related protein and proopiomelanocortin in brain. J Neurosci. 1999;19(18):RC26. - PMC - PubMed
    1. Balthasar N, Coppari R, McMinn J, Liu SM, Lee CE, Tang V, Kenny CD, McGovern RA, Chua SC, Jr, Elmquist JK, Lowell BB. Leptin receptor signaling in POMC neurons is required for normal body weight homeostasis. Neuron. 2004;42(6):983–991. - PubMed
    1. Balthasar N, Dalgaard LT, Lee CE, Yu J, Funahashi H, Williams T, Ferreira M, Tang V, McGovern RA, Kenny CD, Christiansen LM, Edelstein E, Choi B, Boss O, Aschkenasi C, Zhang CY, Mountjoy K, Kishi T, Elmquist JK, Lowell BB. Divergence of melanocortin pathways in the control of food intake and energy expenditure. Cell. 2005;123(3):493–505. - PubMed
    1. Belgardt BF, Okamura T, Bruning JC. Hormone and glucose signalling in POMC and AgRP neurons. J Physiol. 2009;587(Pt 22):5305–5314. - PMC - PubMed

Publication types

MeSH terms