Ovarian cancer and body size: individual participant meta-analysis including 25,157 women with ovarian cancer from 47 epidemiological studies
- PMID: 22606070
- PMCID: PMC3317899
- DOI: 10.1371/journal.pmed.1001200
Ovarian cancer and body size: individual participant meta-analysis including 25,157 women with ovarian cancer from 47 epidemiological studies
Abstract
Background: Only about half the studies that have collected information on the relevance of women's height and body mass index to their risk of developing ovarian cancer have published their results, and findings are inconsistent. Here, we bring together the worldwide evidence, published and unpublished, and describe these relationships.
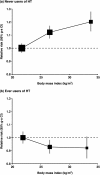
Methods and findings: Individual data on 25,157 women with ovarian cancer and 81,311 women without ovarian cancer from 47 epidemiological studies were collected, checked, and analysed centrally. Adjusted relative risks of ovarian cancer were calculated, by height and by body mass index. Ovarian cancer risk increased significantly with height and with body mass index, except in studies using hospital controls. For other study designs, the relative risk of ovarian cancer per 5 cm increase in height was 1.07 (95% confidence interval [CI], 1.05-1.09; p<0.001); this relationship did not vary significantly by women's age, year of birth, education, age at menarche, parity, menopausal status, smoking, alcohol consumption, having had a hysterectomy, having first degree relatives with ovarian or breast cancer, use of oral contraceptives, or use of menopausal hormone therapy. For body mass index, there was significant heterogeneity (p<0.001) in the findings between ever-users and never-users of menopausal hormone therapy, but not by the 11 other factors listed above. The relative risk for ovarian cancer per 5 kg/m(2) increase in body mass index was 1.10 (95% CI, 1.07-1.13; p<0.001) in never-users and 0.95 (95% CI, 0.92-0.99; p=0.02) in ever-users of hormone therapy.
Conclusions: Ovarian cancer is associated with height and, among never-users of hormone therapy, with body mass index. In high-income countries, both height and body mass index have been increasing in birth cohorts now developing the disease. If all other relevant factors had remained constant, then these increases in height and weight would be associated with a 3% increase in ovarian cancer incidence per decade. Please see later in the article for the Editors' Summary.
Conflict of interest statement
The authors have declared that no competing interests exist.
Figures


References
-
- Casagrande JT, Pike M, Ross R, Louie E, Roy S, et al. ‘Incessant ovulation’ and ovarian cancer. Lancet. 1979;2:170–173. - PubMed
-
- McGowan L, Parent L, Lednar W, Norris HJ. The woman at risk for developing ovarian cancer. Gynecol Oncol. 1979;7:325–344. - PubMed
-
- Hildreth NG, Kelsey JL, LiVolsi VA, Fischer DB, Holford TR, et al. An epidemiologic study of epithelial carcinoma of the ovary. Am J Epidemiol. 1981;114:398–405. - PubMed
-
- Byers T, Marshall J, Graham S, Mettlin C, Swanson M. A case-control study of dietary and nondietary factors in ovarian cancer. J Natl Cancer Inst. 1983;71:681–686. - PubMed
Publication types
MeSH terms
Grants and funding
LinkOut - more resources
Full Text Sources
Other Literature Sources
Medical

