

Macrophage-specific apoE gene repair reduces diet-induced hyperlipidemia and atherosclerosis in hypomorphic Apoe mice
- PMID: 22606237
- PMCID: PMC3351426
- DOI: 10.1371/journal.pone.0035816
Macrophage-specific apoE gene repair reduces diet-induced hyperlipidemia and atherosclerosis in hypomorphic Apoe mice
Abstract
Background: Apolipoprotein (apo) E is best known for its ability to lower plasma cholesterol and protect against atherosclerosis. Although the liver is the major source of plasma apoE, extra-hepatic sources of apoE, including from macrophages, account for up to 10% of plasma apoE levels. This study examined the contribution of macrophage-derived apoE expression levels in diet-induced hyperlipidemia and atherosclerosis.
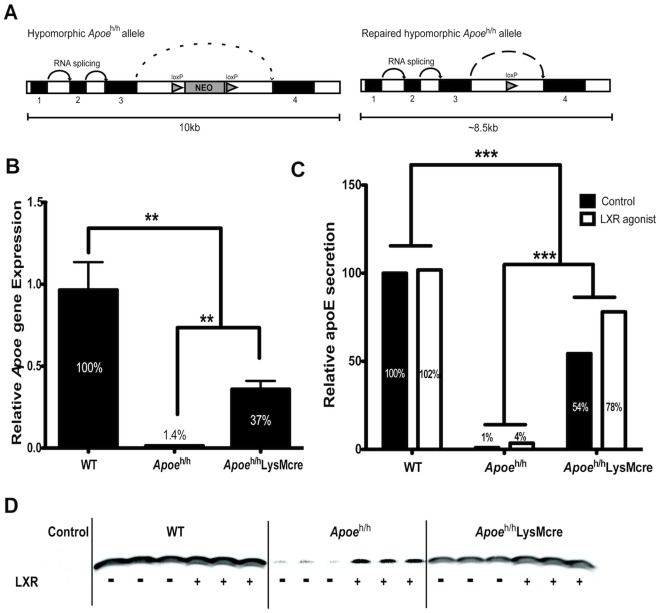
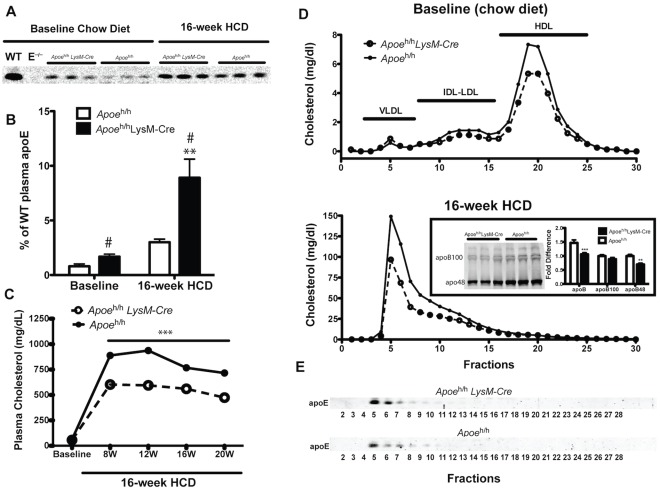
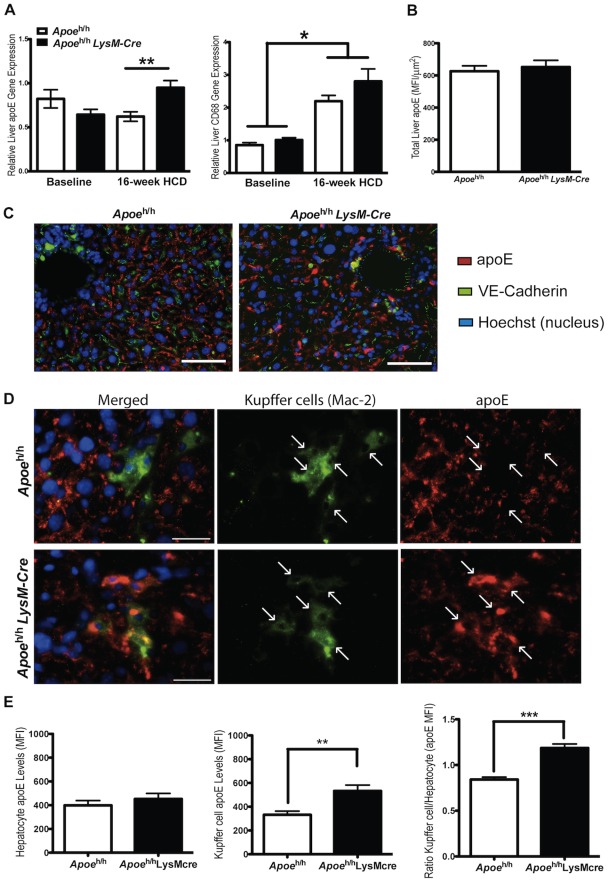
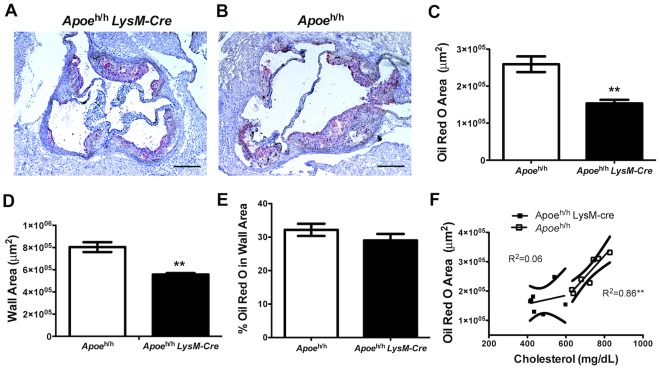
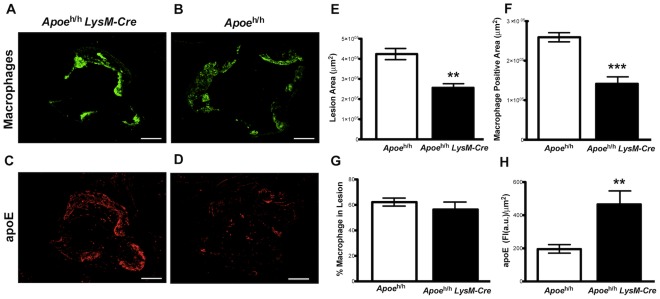
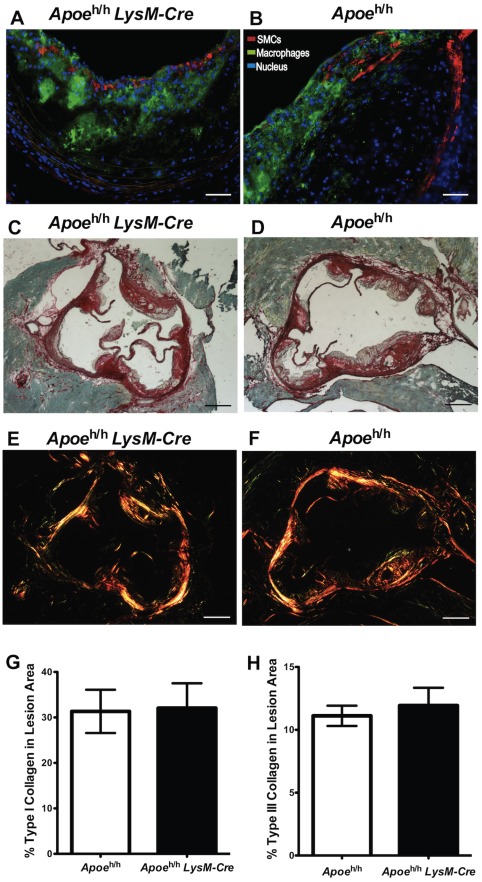
Methodology/principal findings: Hypomorphic apoE (Apoe(h/h)) mice expressing wildtype mouse apoE at ∼2-5% of physiological levels in all tissues were derived by gene targeting in embryonic stem cells. Cre-mediated gene repair of the Apoe(h/h) allele in Apoe(h/h)LysM-Cre mice raised apoE expression levels by 26 fold in freshly isolated peritoneal macrophages, restoring it to 37% of levels seen in wildtype mice. Chow-fed Apoe(h/h)LysM-Cre and Apoe(h/h) mice displayed similar plasma apoE and cholesterol levels (55.53±2.90 mg/dl versus 62.70±2.77 mg/dl, n = 12). When fed a high-cholesterol diet (HCD) for 16 weeks, Apoe(h/h)LysM-Cre mice displayed a 3-fold increase in plasma apoE and a concomitant 32% decrease in plasma cholesterol when compared to Apoe(h/h) mice (602.20±22.30 mg/dl versus 888.80±24.99 mg/dl, n = 7). On HCD, Apoe(h/h)LysM-Cre mice showed increased apoE immunoreactivity in lesional macrophages and liver-associated Kupffer cells but not hepatocytes. In addition, Apoe(h/h)LysM-Cre mice developed 35% less atherosclerotic lesions in the aortic root than Apoe(h/h) mice (167×10(3)±16×10(3) µm(2) versus 259×10(3)±56×10(3) µm(2), n = 7). This difference in atherosclerosis lesions size was proportional to the observed reduction in plasma cholesterol.
Conclusions/significance: Macrophage-derived apoE raises plasma apoE levels in response to diet-induced hyperlipidemia and by such reduces atherosclerosis proportionally to the extent to which it lowers plasma cholesterol levels.
Conflict of interest statement
Figures
Similar articles
-
Inducible ApoE gene repair in hypomorphic ApoE mice deficient in the low-density lipoprotein receptor promotes atheroma stabilization with a human-like lipoprotein profile.Arterioscler Thromb Vasc Biol. 2013 Aug;33(8):1759-67. doi: 10.1161/ATVBAHA.112.300605. Epub 2013 Jun 20. Arterioscler Thromb Vasc Biol. 2013. PMID: 23788760 Free PMC article.
-
Effect of macrophage-derived apolipoprotein E on hyperlipidemia and atherosclerosis of LDLR-deficient mice.Biochem Biophys Res Commun. 2004 Apr 23;317(1):223-9. doi: 10.1016/j.bbrc.2004.03.037. Biochem Biophys Res Commun. 2004. PMID: 15047172
-
Macrophage-specific expression of human apolipoprotein E reduces atherosclerosis in hypercholesterolemic apolipoprotein E-null mice.J Clin Invest. 1995 Nov;96(5):2170-9. doi: 10.1172/JCI118271. J Clin Invest. 1995. PMID: 7593602 Free PMC article.
-
Adipocyte enhancer-binding protein 1 (AEBP1) (a novel macrophage proinflammatory mediator) overexpression promotes and ablation attenuates atherosclerosis in ApoE (-/-) and LDLR (-/-) mice.Mol Med. 2011 Sep-Oct;17(9-10):1056-64. doi: 10.2119/molmed.2011.00141. Epub 2011 Jun 14. Mol Med. 2011. PMID: 21687917 Free PMC article.
-
Apolipoprotein E promotes the regression of atherosclerosis independently of lowering plasma cholesterol levels.Arterioscler Thromb Vasc Biol. 2005 Feb;25(2):436-41. doi: 10.1161/01.ATV.0000152613.83243.12. Epub 2004 Dec 9. Arterioscler Thromb Vasc Biol. 2005. PMID: 15591220
Cited by
-
Do the Apoe-/- and Ldlr-/- Mice Yield the Same Insight on Atherogenesis?Arterioscler Thromb Vasc Biol. 2016 Sep;36(9):1734-41. doi: 10.1161/ATVBAHA.116.306874. Epub 2016 Jul 7. Arterioscler Thromb Vasc Biol. 2016. PMID: 27386935 Free PMC article. Review.
-
ApoE-deficient promotes blood-brain barrier disruption in experimental autoimmune encephalomyelitis via alteration of MMP-9.J Mol Neurosci. 2014;54(2):282-90. doi: 10.1007/s12031-014-0291-x. Epub 2014 May 1. J Mol Neurosci. 2014. PMID: 24788224
-
ApoE knockout and knockin mice: the history of their contribution to the understanding of atherogenesis.J Lipid Res. 2016 May;57(5):758-66. doi: 10.1194/jlr.R067249. Epub 2016 Mar 25. J Lipid Res. 2016. PMID: 27015743 Free PMC article.
-
SR-B1-/-ApoE-R61h/h Mice Mimic Human Coronary Heart Disease.Cardiovasc Drugs Ther. 2024 Dec;38(6):1123-1137. doi: 10.1007/s10557-023-07475-8. Epub 2023 Jun 5. Cardiovasc Drugs Ther. 2024. PMID: 37273155 Free PMC article. Review.
-
VPO1 mediates ApoE oxidation and impairs the clearance of plasma lipids.PLoS One. 2013;8(2):e57571. doi: 10.1371/journal.pone.0057571. Epub 2013 Feb 25. PLoS One. 2013. PMID: 23451244 Free PMC article.
References
-
- Mahley RW. Apolipoprotein E: cholesterol transport protein with expanding role in cell biology. Science. 1988;240:622–630. - PubMed
-
- Ji ZS, Brecht WJ, Miranda RD, Hussain MM, Innerarity TL, et al. Role of heparan sulfate proteoglycans in the binding and uptake of apolipoprotein E-enriched remnant lipoproteins by cultured cells. J Biol Chem. 1993;268:10160–10167. - PubMed
Publication types
MeSH terms
Substances
Grants and funding
LinkOut - more resources
Full Text Sources
Medical
Molecular Biology Databases
Miscellaneous
