. 2012;7(5):e36209.
doi: 10.1371/journal.pone.0036209. Epub 2012 May 11.

Bmi1 confers resistance to oxidative stress on hematopoietic stem cells

Affiliations

Bmi1 confers resistance to oxidative stress on hematopoietic stem cells

Shunsuke Nakamura et al. PLoS One. 2012.

Abstract

Background: The polycomb-group (PcG) proteins function as general regulators of stem cells. We previously reported that retrovirus-mediated overexpression of Bmi1, a gene encoding a core component of polycomb repressive complex (PRC) 1, maintained self-renewing hematopoietic stem cells (HSCs) during long-term culture. However, the effects of overexpression of Bmi1 on HSCs in vivo remained to be precisely addressed.

Methodology/principal findings: In this study, we generated a mouse line where Bmi1 can be conditionally overexpressed under the control of the endogenous Rosa26 promoter in a hematopoietic cell-specific fashion (Tie2-Cre;R26Stop(FL)Bmi1). Although overexpression of Bmi1 did not significantly affect steady state hematopoiesis, it promoted expansion of functional HSCs during ex vivo culture and efficiently protected HSCs against loss of self-renewal capacity during serial transplantation. Overexpression of Bmi1 had no effect on DNA damage response triggered by ionizing radiation. In contrast, Tie2-Cre;R26Stop(FL)Bmi1 HSCs under oxidative stress maintained a multipotent state and generally tolerated oxidative stress better than the control. Unexpectedly, overexpression of Bmi1 had no impact on the level of intracellular reactive oxygen species (ROS).

Conclusions/significance: Our findings demonstrate that overexpression of Bmi1 confers resistance to stresses, particularly oxidative stress, onto HSCs. This thereby enhances their regenerative capacity and suggests that Bmi1 is located downstream of ROS signaling and negatively regulated by it.


Conflict of interest statement

Competing Interests: The authors have declared that no competing interests exist.

Figures

Figure 1
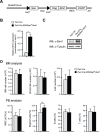
Figure 1. Generation of mice overexpressing Bmi1 in hematopoietic cells.
(A) Strategy for making a knock-in allele for Bmi1 downstream of the Rosa26 promoter. A loxP-flanked neor-stop cassette followed by Flag-tagged Bmi1, an frt-flanked IRES-eGFP cassette, and a bovine polyadenylation sequence was knocked-in the Rosa26 locus. (B) Quantitative RT-PCR analysis of Bmi1 in BM LSK cells from Tie2-Cre and Tie2-Cre;R26StopFLBmi1 mice. mRNA levels were normalized to Hprt1 expression. Expression levels relative to that in Tie2-Cre LSK cells are shown as the mean ± S.D. (n = 3). (C) Western blotting analysis of Bmi1 in c-Kit+ BM cells from Tie2-Cre and Tie2-Cre;R26StopFLBmi1 mice. α-tubulin was used as the loading control. (D) Hematopoietic analysis of 10-week-old Tie2-Cre and Tie2-Cre;R26StopFLBmi1 mice. Absolute numbers of BM cells, CD34-LSK cells, and LSK cells in bilateral femurs and tibiae are presented as the mean ± S.D. (upper panels, Tie2-Cre; n = 7, Tie2-Cre;R26StopFLBmi1; n = 8). PB analysis of 10-week-old Tie2-Cre and Tie2-Cre;R26StopFLBmi1 mice. White blood cell (WBC) counts and lineage contribution of myeloid, B, and T cells are shown as the mean ± S.D. (lower panels, Tie2-Cre; n = 7, Tie2-Cre;R26StopFLBmi1; n = 8). ** p<0.01.
Figure 2
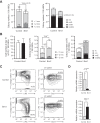
Figure 2. Effects of overexpression of Bmi1 on HSCs in vitro.
(A) Colony formation by HSCs isolated from Tie2-Cre (Control) and Tie2-Cre;R26StopFLBmi1 (Bmi1) mice. Single CD34-LSK cells were sorted into 96-well microtiter plates containing the SF-O3 medium supplemented with 10% FBS and multiple cytokines (10 ng/ml SCF, 10 ng/ml TPO, 10 ng/ml IL-3, and 3 u/ml EPO) and allowed to form colonies. At day 14 of culture, the colonies were counted and individually collected for morphological examination. Absolute numbers of LPP and HPP-CFCs which gave rise to colonies with a diameter less and greater than 1 mm, respectively are shown as the mean ± S.D. for triplicate cultures (left panel). Absolute numbers of each colony types were defined by the composition of colonies (right panel). Colonies were recovered and examined by microscopy to determine colony types. Composition of colonies is depicted as n, neutrophils; m, macrophages; E, erythroblasts; and M, megakaryocytes. (B) Colony formation by HSCs cultured for 10 days. CD34-LSK cells from Tie2-Cre (Control) and Tie2-Cre;R26StopFLBmi1 (Bmi1) mice were cultured in the SF-O3 serum-free medium supplemented with 50 ng/ml of SCF and TPO. At day 10 of culture, the cells were counted (left panel) and plated in methylcellulose medium to allow formation of colonies in the presence of 20 ng/ml SCF, 20 ng/ml TPO, 20 ng/ml IL-3, and 3 u/ml EPO. Absolute numbers of LPP and HPP-CFCs (middle panel) are shown as the mean ± S.D. for triplicate cultures. Absolute numbers of each colony type are shown in the right panel. (C) Flow cytometric analysis of CD34-LSK HSCs at day14 of culture. Representative flow cytometric profiles of LSK cells in cultures of CD34-LSK HSCs from Tie2-Cre (Control) and Tie2-Cre;R26StopFLBmi1 (Bmi1) mice are depicted. The proportion of Lin- and LSK cells in total cells are indicated. (D) Quantitative RT-PCR analysis of the expression of p19Arf, and Bmi1 in Tie2-Cre (Control) and Tie2-Cre;R26StopFLBmi1 (Bmi1) LSK cells. LSK cells were purified by cell sorting from CD34-LSK cultures in (C) at day 14 of culture. Each value was normalized to Hprt1 expression and the expression level of each gene in control cells was arbitrarily set to 1. Data are shown as the mean ± S.D. for triplicate analyses. * p<0.05, **p<0.01.
Figure 3
Figure 3. Overexpression of Bmi1 enhances expansion of HSCs ex vivo.
Competitive repopulating unit (CRU) assays using limiting numbers of CD34-LSK cells from Tie2-Cre (Control) mice and Tie2-Cre;R26StopFLBmi1 (Bmi1) mice. Freshly isolated CD34-LSK cells were immediately used for BM transplantation, or CD34-LSK cells were cultured in the SF-O3 serum-free medium supplemented with 50 ng/ml SCF and TPO for 10 days, and then a fraction of the culture cells corresponding to the indicated number (0.5∼10) of initial CD34-LSK cells was subjected to BM transplantation. The test cells (CD45.2) were transplanted along with 2×10⁵ competitor BM cells (CD45.1) into CD45.1 recipient mice lethally irradiated at a dose of 9.5 Gy. Percent chimerism of donor cells in the recipient PB was determined at 16 weeks after transplantation. The mice with chimerism more than 1% in all three lineages (myeloid, B, and T cells) were considered successfully engrafted and the others were defined as negative mice. The frequency of HSCs was calculated using L-Calc software. The proportion of engrafted mice, frequency of functional HSCs, and the 95% confidence interval (CI) are summarized in the table and each data is plotted in the bottom panel. *** p<0.001.
Figure 4
Figure 4. Overexpression of Bmi1 protects HSCs during serial transplantation.
(A) Serial transplantation of BM cells. BM cells (5×10⁵) from Tie2-Cre (denoted as “C”) and Tie2-Cre;R26StopFLBmi1 (denoted as “B”) mice (CD45.2) along with 5×10⁵ competitor BM cells (CD45.2) were transplanted into CD45.1 recipient mice lethally irradiated at a dose of 9.5 Gy. For serial transplantation, BM cells were collected from all recipient mice at 12–20 weeks after transplantation and pooled together. Then, 5×10⁶ BM cells were transplanted into lethally irradiated recipient mice without competitor cells. Third and fourth transplantation were similarly performed using 5×10⁶ pooled BM cells. Percent chimerism of donor cells in the recipient PB and BM LSK cells was determined at 16 weeks post-transplantation. Results are shown as the mean ± S.D. (n = 6, 3rd transplantation; n = 4). (B) Serial transplantation of cultured CD34-LSK cells. CD34-LSK cells were cultured in the SF-O3 serum-free medium supplemented with 50 ng/ml of SCF and TPO for 10 days. Then, the cells in culture corresponding to the 20 initial CD34-LSK cells were injected into a recipient mouse along with 2×10⁵ competitor BM cells (CD45.2) as described in (A) (n = 6, 4th transplantation; n = 5). * P<0.05, ** P<0.01.
Figure 5
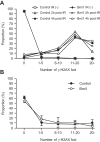
Figure 5. DNA damage response of Tie2-Cre;R26StopFLBmi1 HSCs.
(A) DNA damage response of CD34-LSK cells from Tie2-Cre (Control) and Tie2-Cre;R26StopFLBmi1 (Bmi1) mice in vitro. Purified CD34-LSK cells were irradiated (IR) at a dose of 2 Gy. At 2 and 4 hours after irradiation, cells were stained with anti-γH2AX. Numbers of γH2AX foci expressed per cell are depicted. (B) DNA damage response of CD34-LSK cells from Tie2-Cre (Control) and Tie2-Cre;R26StopFLBmi1 (Bmi1) mice in vivo. LSK cells were purified from the recipients of tertiary transplantation and stained with anti-γH2AX. Numbers of γH2AX foci expressed per cell are depicted as the mean ± S.D. (n = 3).
Figure 6
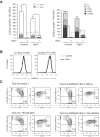
Figure 6. Overexpression of Bmi1 confers oxidative stress on HSCs.
(A) Colony formation by HSCs cultured for 3 days. CD34-LSK cells from Tie2-Cre (Control) and Tie2-Cre;R26StopFLBmi1 (Bmi1) mice were cultured in the SF-O3 serum-free medium supplemented with 50 ng/ml SCF, TPO and 0.05 mM of BSO. At day 3 of culture, the cells were plated in methylcellulose medium to allow formation of colonies in the presence of 20 ng/ml SCF, 20 ng/ml TPO, 20 ng/ml IL-3, and 3 u/ml EPO. Absolute numbers of LPP and HPP-CFCs (left panel) are shown as the mean ± S.D. for triplicate cultures. Absolute numbers of each colony types are shown in the right panel. Data are shown as the mean ± S.D. for triplicate analyses. Statistical analyses were performed on the total colony numbers (left panel) and nmEM colony numbers (right panel), respectively. **p<0.01. (B) Levels of ROS in cells overexpressing Bmi1. CD34-LSK cells from Tie2-Cre (Control) and Tie2-Cre;R26StopFLBmi1 (Bmi1) mice were cultured in the SF-O3 serum-free medium supplemented with 50 ng/ml SCF and TPO. Representative flow cytometric profiles of LSK and Lineage marker-Sca-1low/−c-Kit+ cells in cultures at day 14 are depicted. (C) Effects of NAC on Bmi1 culture. CD34-LSK cells from Tie2-Cre and Tie2-Cre;R26StopFLBmi1 mice were cultured in the SF-O3 serum-free medium supplemented with 50 ng/ml SCF and TPO in the presence and absence of 150 µM NAC. Representative flow cytometric profiles of LSK cells in cultures at day 14 are depicted. The proportion of Lin- and LSK cells in total cells are indicated.

Similar articles

Cited by

References

    1. Simon JA, Kingston RE. Mechanisms of polycomb gene silencing: knowns and unknowns. Nat Rev Mol Cell Biol. 2009;10:697–708. - PubMed
    1. Iwama A, Oguro H, Negishi M, Kato Y, Nakauchi H. Epigenetic regulation of hematopoietic stem cell self-renewal by polycomb group genes. Int J Hematol. 2005;81:294–300. - PubMed
    1. Konuma T, Oguro H, Iwama A. Role of the polycomb group proteins in hematopoietic stem cells. Dev Growth Differ. 2010;52:505–516. - PubMed
    1. Sauvageau M, Sauvageau G. Polycomb group proteins: multi-faceted regulators of somatic stem cells and cancer. Cell Stem Cell. 2010;7:299–313. - PMC - PubMed
    1. Lessard J, Sauvageau G. Bmi-1 determines the proliferative capacity of normal and leukaemic stem cells. Nature. 2003;423:255–260. - PubMed

Publication types

MeSH terms