. 2012;7(5):e36262.
doi: 10.1371/journal.pone.0036262. Epub 2012 May 14.

Microbiota/host crosstalk biomarkers: regulatory response of human intestinal dendritic cells exposed to Lactobacillus extracellular encrypted peptide

Affiliations

Microbiota/host crosstalk biomarkers: regulatory response of human intestinal dendritic cells exposed to Lactobacillus extracellular encrypted peptide

David Bernardo et al. PLoS One. 2012.

Abstract

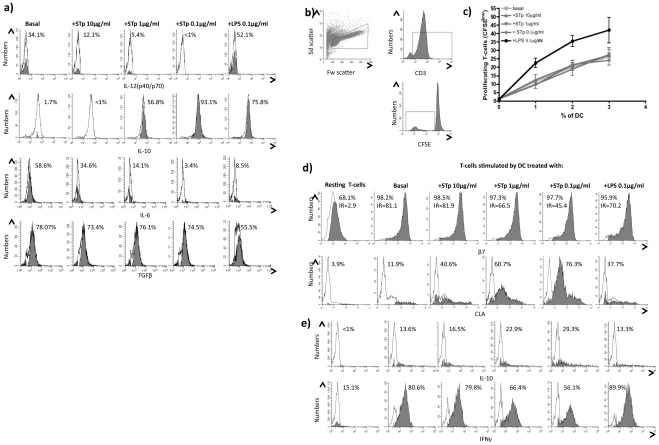
The human gastrointestinal tract is exposed to a huge variety of microorganisms, either commensal or pathogenic; at this site, a balance between immunity and immune tolerance is required. Intestinal dendritic cells (DCs) control the mechanisms of immune response/tolerance in the gut. In this paper we have identified a peptide (STp) secreted by Lactobacillus plantarum, characterized by the abundance of serine and threonine residues within its sequence. STp is encoded in one of the main extracellular proteins produced by such species, which includes some probiotic strains, and lacks cleavage sites for the major intestinal proteases. When studied in vitro, STp expanded the ongoing production of regulatory IL-10 in human intestinal DCs from healthy controls. STp-primed DC induced an immunoregulatory cytokine profile and skin-homing profile on stimulated T-cells. Our data suggest that some of the molecular dialogue between intestinal bacteria and DCs may be mediated by immunomodulatory peptides, encoded in larger extracellular proteins, secreted by commensal bacteria. These peptides may be used for the development of nutraceutical products for patients with IBD. In addition, this kind of peptides seem to be absent in the gut of inflammatory bowel disease patients, suggesting a potential role as biomarker of gut homeostasis.


Conflict of interest statement

Competing Interests: The authors have declared that no competing interests exist.

Figures

Figure 1
Figure 1. Structure, purification and location of the ST peptide.
a) Domain structure of the protein D1, where the ST peptide is encoded (S/T domain); b) Western blot performed with a specific horseradish peroxidase-conjugated anti His5 antibody, showing the anomalous migration of the purified His-tagged ST peptide (marked with an arrow); c) Western blot using the polyclonal anti-STp serum as primary antibody; specific immunoreactive bands are labelled with arrows; -: complete medium (negative control), HC#: protein extracts obtained from culture supernatants of healthy colonic biopsies, F#: Some culture supernatants were 0.2 µm filtered prior to protein extraction, D# and E#: protein extracts from culture supernatants of human epidermal and dermal layer cultures respectively.
Figure 2
Figure 2. STp induced i) regulatory cytokines in blood enriched DC and ii) stimulated T-cells, which acquired a skin homing profile.
a) Intracellular ongoing cytokine production of IL-12(p40/p70), IL-10, IL-6 and TGFβ in blood DC of healthy controls after 24 hours stimulation with STp (10 µg/ml, 1 µg/ml and 0.1 µg/ml) or LPS (100 ng/ml) compared to a basal culture. Closed histograms represent the percentage of positive cells assessed by intracellular cytokine staining and SED normalized subtraction from antibody stained cells cultured in the absence of monensin. That approach accurately quantifies the ongoing cytokine production of DC in a time window of 4 hours (monensin incubation) irrespectively of the initial cytokine amounts within the cells. b) Stimulatory capacity of DC was assayed in a mixed leukocyte reaction (MLR). T-cells were identified in the forward (Fw) and side (Sd scatter) and subsequent CD3 identification of dividing T-cells as CD3+ and CFSElow. c) Dose response proliferation of T-cells upon 5 days stimulation with different doses of allogeneic DC (0%, 1%, 2% and 3%) previously pulsed with different doses of STp or LPS compared to untreated DC (basal). Results show the mean±SEM of three independent experiments. d) Imprinted homing profile of stimulated T-cells (CFSElow) was determined regarding their surface expression and intensity ratio (IR) for the gut-homing integrin β7 and the skin-homing CLA molecules compared to resting T-cells cultured in the absence of DC. e) Acquired cytokine profile of such cells was determined as intracellular cytokine content of both IL-10 and IFNγ. Closed histograms represent the percentage of positive cells after subtraction from respective isotypes. All displayed histograms are representative of three independent experiments performed with similar results.
Figure 3
Figure 3. STp primes human intestinal DC towards a regulatory phenotype.
a) DC were identified in total colonic lamina propria mononuclear cells from healthy controls by flow cytometry according to the Forward and Side scatters and the subsequent HLA-DR/lineage cocktail dot plot. DC were defined as HLA-DR+ and lineage (CD3, CD14, CD16, CD19 and CD34). b) Ongoing intracellular IL-10 and IL-12(p40/p70) cytokine production (closed histograms) was determined in colonic DC cultured with and without STp (10 µg/ml). Pooled data of 8 independent experiments are shown in panel c). d) Stimulatory capacity of such intestinal DC was determined upon 5 days culture in the presence of allogeneic CFSE-labelled T-cells as stated in Figure 2c. Results show the mean±SEM of 8 independent experiments. e) Imprinted homing profile (gut-homing: β7; skin-homing: CLA) and intracellular cytokine content (IL-10 and IFNγ) of stimulated T-cells (CFSElow) was compared to resting T-cells cultured in the absence of intestinal DC. Pooled data of eight independent experiments is shown in panel f). Closed histograms represent the percentage of positive cells after subtraction from respective isotypes. Lines and bars represent mean±SEM.

Similar articles

Cited by

References

    1. Mowat AM. Anatomical basis of tolerance and immunity to intestinal antigens. Nat Rev Immunol. 2003;3:331–341. - PubMed
    1. Banchereau J, Steinman RM. Dendritic cells and the control of immunity. Nature. 1998;392:245–252. - PubMed
    1. Chirdo FG, Millington OR, Beacock-Sharp H, Mowat AM. Immunomodulatory dendritic cells in intestinal lamina propria. Eur J Immunol. 2005;35:1831–1840. - PubMed
    1. Hart AL, Lammers K, Brigidi P, Vitali B, Rizzello F, et al. Modulation of human dendritic cell phenotype and function by probiotic bacteria. Gut. 2004;53:1602–1609. - PMC - PubMed
    1. Stagg AJ, Hart AL, Knight SC, Kamm MA. The dendritic cell: its role in intestinal inflammation and relationship with gut bacteria. Gut. 2003;52:1522–1529. - PMC - PubMed

Publication types

MeSH terms