. 2012;7(5):e36298.
doi: 10.1371/journal.pone.0036298. Epub 2012 May 11.

Bacterial communities of the coronal sulcus and distal urethra of adolescent males

Affiliations

Bacterial communities of the coronal sulcus and distal urethra of adolescent males

David E Nelson et al. PLoS One. 2012.

Abstract

Lactobacillus-dominated vaginal microbiotas are associated with reproductive health and STI resistance in women, whereas altered microbiotas are associated with bacterial vaginosis (BV), STI risk and poor reproductive outcomes. Putative vaginal taxa have been observed in male first-catch urine, urethral swab and coronal sulcus (CS) specimens but the significance of these observations is unclear. We used 16 S rRNA sequencing to characterize the microbiota of the CS and urine collected from 18 adolescent men over three consecutive months. CS microbiotas of most participants were more stable than their urine microbiotas and the composition of CS microbiotas were strongly influenced by circumcision. BV-associated taxa, including Atopobium, Megasphaera, Mobiluncus, Prevotella and Gemella, were detected in CS specimens from sexually experienced and inexperienced participants. In contrast, urine primarily contained taxa that were not abundant in CS specimens. Lactobacilllus and Streptococcus were major urine taxa but their abundance was inversely correlated. In contrast, Sneathia, Mycoplasma and Ureaplasma were only found in urine from sexually active participants. Thus, the CS and urine support stable and distinct bacterial communities. Finally, our results suggest that the penis and the urethra can be colonized by a variety of BV-associated taxa and that some of these colonizations result from partnered sexual activity.


Conflict of interest statement

Competing Interests: The authors have declared that no competing interests exist.

Figures

Figure 1
Figure 1. Comparison of CS and urine microbiotas measured by different 16 S rRNA sequencing methods.
Distribution of RDP taxa (90% confidence) in enrollment (A) CS and (B) urine specimens. Proportions of normalized sequences are on the Y-axis. (black) Sanger, (white) V1–V3, (dark gray) V3–V5 and (light gray) V6–V9 sequence data sets.
Figure 2
Figure 2. Distribution of major taxa in enrollment CS and urine specimens. Sanger data-set.
(A) CS specimens. (B) urine specimens.
Figure 3
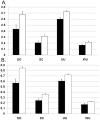
Figure 3. Comparison of intraperson and interperson similarity of CS and urine microbiotas.
Black bars indicate comparison of specimens from the same participant (4 specimens) and white bars indicate comparison of each specimen to all specimens from different participants. A) CS specimens. B) Urine specimens. SO, Sørenson similarity index; SC, Spearman similarity coefficient; UU, unweighted Unifrac distance; WU, weighted Unifrac distance. Wilcoxon P-values for all comparisons (same versus different participants) were all <1 E 10−6. Bars indicate 95% confidence intervals.
Figure 4
Figure 4. Temporal stability of CS and urine taxa
. Lin’s concordance correlation coefficients (Y-axis) were calculated to assess agreement of abundance of taxa, (X-axis), in sequential (A) CS, or (B) urine specimens from the same participants (three intervals: months 0–1, 1–2, 2–3), the red trend line indicates mean of the three intervals. Bars indicate 95% confidence intervals.
Figure 5
Figure 5. Impact of circumcision on the CS and urine microbiotas.
Relative normalized abundance of major (A) CS and (B) urine taxa in circumcised (red) and uncircumcised (blue) participants at all four sampling points (Z-axis). Bars indicate 95% confidence intervals.
Figure 6
Figure 6. Similarity of CS and urine taxa
. A-C) Weighted Unifrac comparison of the microbiotas in select groups of specimens (Sanger data-set). A) All CS (red) and all urine (blue) specimens. B) Circumcised (red) and uncircumcised (blue) CS specimens. C) Circumcised (red) and uncircumcised (blue) urine specimens.
Figure 7
Figure 7. The microbiota of the CS is more stable than that of urine.
Sørenson’s similarity indices calculated between pairwise specimens within each participant’s (month = 0, 1, 2, 3) CS and urine samples, separately. A linear mixed-effects model was used to test if the index differed between CS and urine samples, taking into account multiple specimens from the same participants (clustered data). Participants are indicated at left, Sørenson similarity values are on the Y-axis, and blue dots indicate unique specimens.

References

    1. Frank DN, Zhu W, Sartor RB, Li E. Trends Microbiol; 2011. Investigating the biological and clinical significance of human dysbioses. - PMC - PubMed
    1. Chang JY, Antonopoulos DA, Kalra A, Tonelli A, Khalife WT, et al. Decreased diversity of the fecal Microbiome in recurrent Clostridium difficile-associated diarrhea. J Infect Dis. 2008;197:435–438. - PubMed
    1. Frank DN, St Amand AL, Feldman RA, Boedeker EC, Harpaz N, et al. Molecular-phylogenetic characterization of microbial community imbalances in human inflammatory bowel diseases. Proc Natl Acad Sci U S A. 2007;104:13780–13785. - PMC - PubMed
    1. Eckburg PB, Relman DA. The role of microbes in Crohn’s disease. Clin Infect Dis. 2007;44:256–262. - PubMed
    1. Stecher B, Chaffron S, Kappeli R, Hapfelmeier S, Freedrich S, et al. Like will to like: abundances of closely related species can predict susceptibility to intestinal colonization by pathogenic and commensal bacteria. PLoS Pathog. 2010;6:e1000711. - PMC - PubMed

Publication types