

VENNTURE--a novel Venn diagram investigational tool for multiple pharmacological dataset analysis
- PMID: 22606307
- PMCID: PMC3351456
- DOI: 10.1371/journal.pone.0036911
VENNTURE--a novel Venn diagram investigational tool for multiple pharmacological dataset analysis
Erratum in
- PLoS One. 2012;7(5): doi/10.1371/annotation/27f1021c-b6f2-4b90-98bc-fcacd2679185
Abstract
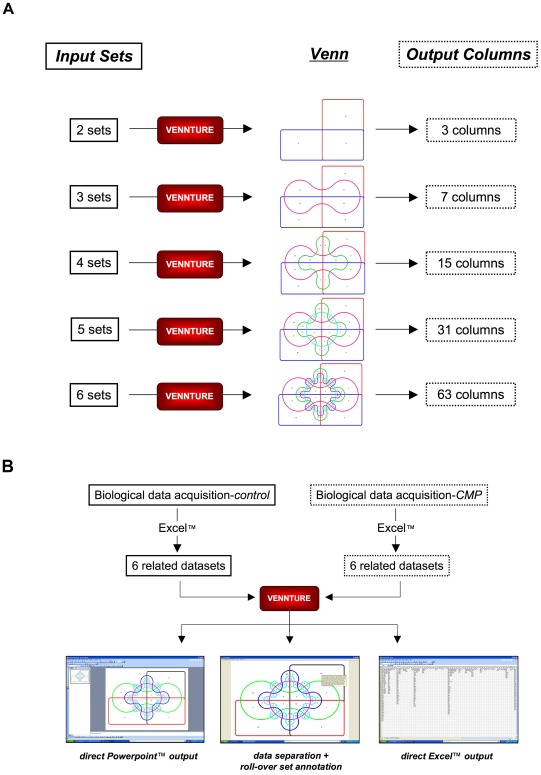
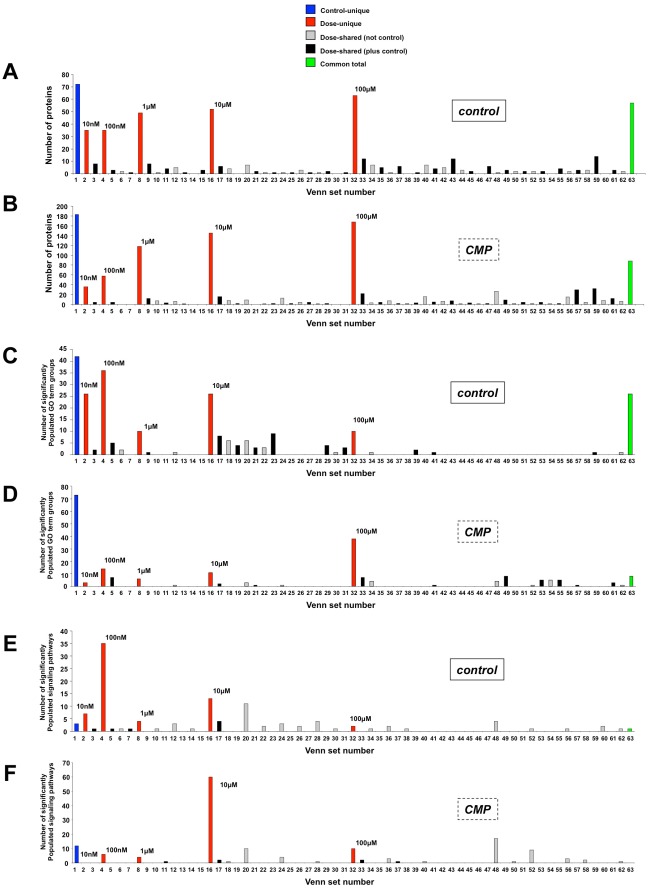
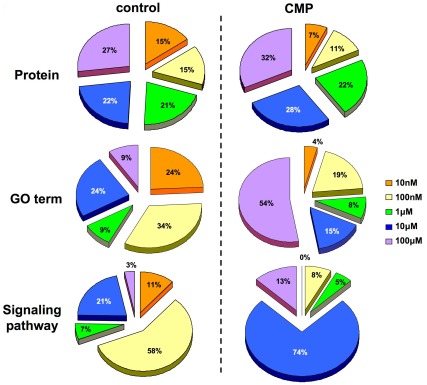
As pharmacological data sets become increasingly large and complex, new visual analysis and filtering programs are needed to aid their appreciation. One of the most commonly used methods for visualizing biological data is the Venn diagram. Currently used Venn analysis software often presents multiple problems to biological scientists, in that only a limited number of simultaneous data sets can be analyzed. An improved appreciation of the connectivity between multiple, highly-complex datasets is crucial for the next generation of data analysis of genomic and proteomic data streams. We describe the development of VENNTURE, a program that facilitates visualization of up to six datasets in a user-friendly manner. This program includes versatile output features, where grouped data points can be easily exported into a spreadsheet. To demonstrate its unique experimental utility we applied VENNTURE to a highly complex parallel paradigm, i.e. comparison of multiple G protein-coupled receptor drug dose phosphoproteomic data, in multiple cellular physiological contexts. VENNTURE was able to reliably and simply dissect six complex data sets into easily identifiable groups for straightforward analysis and data output. Applied to complex pharmacological datasets, VENNTURE's improved features and ease of analysis are much improved over currently available Venn diagram programs. VENNTURE enabled the delineation of highly complex patterns of dose-dependent G protein-coupled receptor activity and its dependence on physiological cellular contexts. This study highlights the potential for such a program in fields such as pharmacology, genomics, and bioinformatics.
Conflict of interest statement
Figures


References
-
- Venn J. On the Diagrammatic and Mechanical Representation of Propositions and Reasonings. Philosophical Magazine and Journal of Science. 1880;9:1–18.
-
- Edwards AWF. Venn diagrams for many sets. Bulletin of the International Statistical Institute. 1989;1:311–312.
-
- Oliveros JC. VENNY. An interactive tool for comparing lists with Venn Diagrams. 2007;18 Venny website: http://bioinfogp.cnb.csic.es/tools/venny/. Accessed 2012 April.
Publication types
MeSH terms
Substances
Grants and funding
LinkOut - more resources
Full Text Sources
Other Literature Sources
