

Inferring carbon sources from gene expression profiles using metabolic flux models
- PMID: 22606312
- PMCID: PMC3351459
- DOI: 10.1371/journal.pone.0036947
Inferring carbon sources from gene expression profiles using metabolic flux models
Erratum in
- PLoS One. 2012;7(8). doi: 10.1371/annotation/139857f3-5a05-4a23-9bfe-a77aafbce54d
Abstract
Background: Bacteria have evolved the ability to efficiently and resourcefully adapt to changing environments. A key means by which they optimize their use of available nutrients is through adjustments in gene expression with consequent changes in enzyme activity. We report a new method for drawing environmental inferences from gene expression data. Our method prioritizes a list of candidate carbon sources for their compatibility with a gene expression profile using the framework of flux balance analysis to model the organism's metabolic network.
Principal findings: For each of six gene expression profiles for Escherichia coli grown under differing nutrient conditions, we applied our method to prioritize a set of eighteen different candidate carbon sources. Our method ranked the correct carbon source as one of the top three candidates for five of the six expression sets when used with a genome-scale model. The correct candidate ranked fifth in the remaining case. Additional analyses show that these rankings are robust with respect to biological and measurement variation, and depend on specific gene expression, rather than general expression level. The gene expression profiles are highly adaptive: simulated production of biomass averaged 94.84% of maximum when the in silico carbon source matched the in vitro source of the expression profile, and 65.97% when it did not.
Conclusions: Inferences about a microorganism's nutrient environment can be made by integrating gene expression data into a metabolic framework. This work demonstrates that reaction flux limits for a model can be computed which are realistic in the sense that they affect in silico growth in a manner analogous to that in which a microorganism's alteration of gene expression is adaptive to its nutrient environment.
Conflict of interest statement
Figures
 in Figure 2, Panel A). Each reaction is given a flux limit corresponding to the maximum optimal flux solution over the two in silico nutrient uptake conditions. The shading is orange for in silico glucose growth, blue for in silico acetate and grey where the two solutions overlap. Panel B. Creation of the glucose expression-derived flux limits (corresponding to
  in Figure 2, Panel B). Each flux limit shown in Panel A has been scaled by the level of gene expression for in vivo growth on glucose relative to the maximum gene expression for that reaction over both nutrient conditions. The arrows indicate two reactions for which gene expression was significantly lower on glucose than on acetate, resulting in significantly reduced flux limits. Panel C. Effect of the glucose expression-derived flux limits of Panel B on in silico glucose growth. The glucose optimal flux from Panel A (orange region) lies within the limits; biomass production is not changed. Panel D. Effect of the glucose expression-derived flux limits of Panel B on in silico acetate growth. The acetate optimal flux from Panel A (blue region) exceeds the flux limits for several reactions. (This is analogous to the optimal flux vector
  lying outside the flux cone in Figure 2, Panel B.) Hence the flux limits will lead to smaller optimal fluxes for these reactions and reduced biomass production. Relative biomass production is therefore smaller for in silico acetate than for in silico glucose, and we conclude that glucose is the more likely carbon source for the expression data.
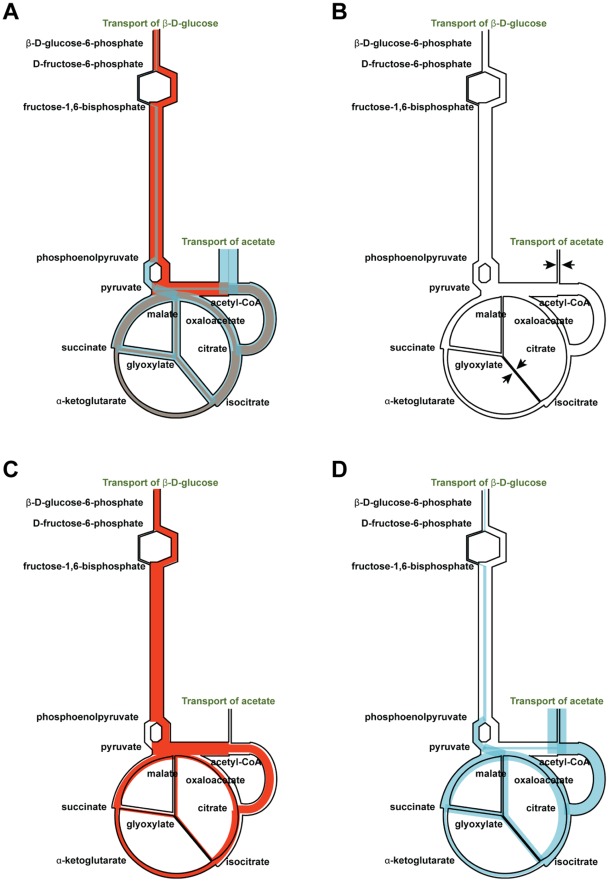
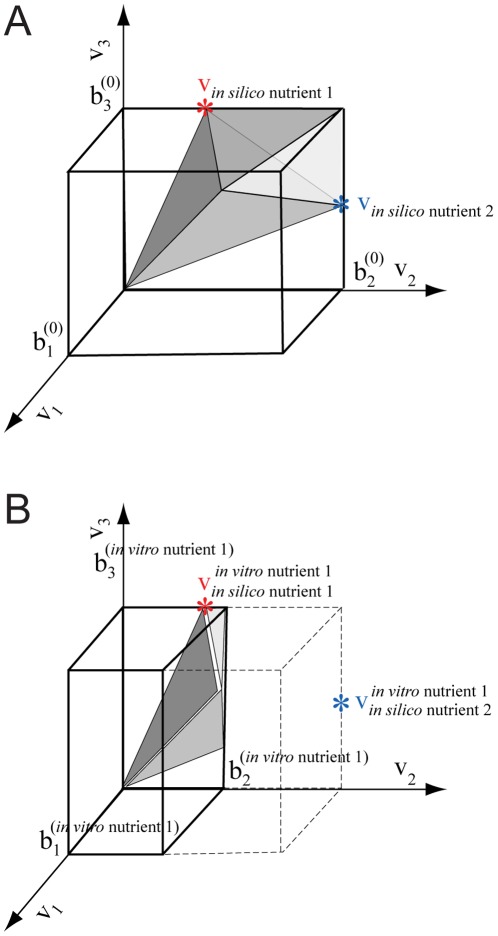
 These solutions of the baseline FBA model constrained by in silico nutrient uptake lie on the surface of the flux cone. For each dimension j the baseline upper flux limit is denoted
  Panel B. Creation of the expression-derived flux limits by scaling the baseline flux limits. The upper flux limit for dimension j derived using expression data for the unknown in vitro nutrient l is denoted
  and the solution vectors are denoted
  The baseline flux limits are indicated with dashed lines, the scaled limits are indicated by solid lines. In this hypothetical example the expression of the gene for the enzymatic reaction producing flux v2 is 40% of the maximal expression level for that gene under the other nutrient condition. The maximal flux for this reaction is set to 40% of its original level. This smaller flux cone represents the metabolic capabilities of the organism under the corresponding growth condition. The solution vector producing optimal biomass for nutrient 1 has not changed with the new flux limits, but the solution vector for nutrient 2 has been reduced in magnitude, with a consequent reduction in biomass production. Relative biomass production will be larger for nutrient 1 than for nutrient 2. We would therefore conclude that the in vitro nutrient l that gave rise to the expression profile is probably nutrient 1, rather than nutrient 2.
Similar articles
-
Genome-scale metabolic modelling when changes in environmental conditions affect biomass composition.PLoS Comput Biol. 2021 May 24;17(5):e1008528. doi: 10.1371/journal.pcbi.1008528. eCollection 2021 May. PLoS Comput Biol. 2021. PMID: 34029317 Free PMC article.
-
Flux analysis and control of the central metabolic pathways in Escherichia coli.FEMS Microbiol Rev. 1996 Dec;19(2):85-116. doi: 10.1111/j.1574-6976.1996.tb00255.x. FEMS Microbiol Rev. 1996. PMID: 8988566 Review.
-
Gene Dispensability in Escherichia coli Grown in Thirty Different Carbon Environments.mBio. 2020 Sep 29;11(5):e02259-20. doi: 10.1128/mBio.02259-20. mBio. 2020. PMID: 32994326 Free PMC article.
-
Environmental versatility promotes modularity in genome-scale metabolic networks.BMC Syst Biol. 2011 Aug 24;5:135. doi: 10.1186/1752-0509-5-135. BMC Syst Biol. 2011. PMID: 21864340 Free PMC article.
-
Constraining the metabolic genotype-phenotype relationship using a phylogeny of in silico methods.Nat Rev Microbiol. 2012 Feb 27;10(4):291-305. doi: 10.1038/nrmicro2737. Nat Rev Microbiol. 2012. PMID: 22367118 Free PMC article. Review.
Cited by
-
Systematic evaluation of methods for integration of transcriptomic data into constraint-based models of metabolism.PLoS Comput Biol. 2014 Apr 24;10(4):e1003580. doi: 10.1371/journal.pcbi.1003580. eCollection 2014 Apr. PLoS Comput Biol. 2014. PMID: 24762745 Free PMC article.
-
Simulating Serial-Target Antibacterial Drug Synergies Using Flux Balance Analysis.PLoS One. 2016 Jan 28;11(1):e0147651. doi: 10.1371/journal.pone.0147651. eCollection 2016. PLoS One. 2016. PMID: 26821252 Free PMC article.
-
Predicting bacterial growth conditions from mRNA and protein abundances.PLoS One. 2018 Nov 2;13(11):e0206634. doi: 10.1371/journal.pone.0206634. eCollection 2018. PLoS One. 2018. PMID: 30388153 Free PMC article.
-
Modeling tissue-relevant Caenorhabditis elegans metabolism at network, pathway, reaction, and metabolite levels.Mol Syst Biol. 2020 Oct;16(10):e9649. doi: 10.15252/msb.20209649. Mol Syst Biol. 2020. PMID: 33022146 Free PMC article.
-
Spirulina-in Silico-Mutations and Their Comparative Analyses in the Metabolomics Scale by Using Proteome-Based Flux Balance Analysis.Cells. 2020 Sep 15;9(9):2097. doi: 10.3390/cells9092097. Cells. 2020. PMID: 32942547 Free PMC article.
References
-
- Gorke B, Stulke J. Carbon catabolite repression in bacteria: many ways to make the most out of nutrients. Nature Reviews: Microbiology. 2008;6:613–624. - PubMed
-
- Timm J, Post FA, Bekker L-G, Walther GB, Wainwright HC, et al. Differential expression of iron-, carbon-, and oxygen-responsive mycobacterial genes in the lungs of chronically infected mice and tuberculosis patients. Proceedings of the National Academy of Sciences, USA. 2003;100:14321–14326. - PMC - PubMed
-
- Baev MV, Baev D, Radek AJ, Campbell JW. Growth of Escherichia coli MG1655 on LB medium: monitoring utilization of sugars, alcohols, and organic acids with transcriptional microarrays. Applied Microbiology and Biotechnology. 2006;71:310–316. - PubMed
Publication types
MeSH terms
Substances
Grants and funding
LinkOut - more resources
Full Text Sources
Other Literature Sources
