. 2012;7(5):e36993.
doi: 10.1371/journal.pone.0036993. Epub 2012 May 11.

Not all locations are created equal: exploring how adults hide and search for objects

Affiliations

Not all locations are created equal: exploring how adults hide and search for objects

Eric L G Legge et al. PLoS One. 2012.

Abstract

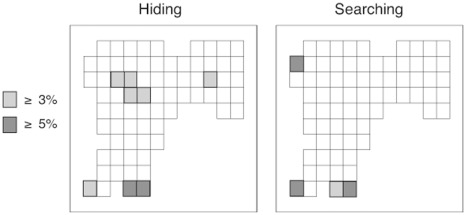
Little is known about the strategies people use to effectively hide objects from others, or to search for objects others have hidden. The present research extends a recent investigation of people's hiding and searching strategies in a simple room with 9 cache location. In the present studies, people hid and searched for three objects under more than 70 floor tiles in complex real and virtual rooms. Experiment 1 replicated several finding of Talbot et al within the more complex real and virtual environments. Specifically, people traveled further from origin and selected more dispersed locations when hiding than when searching. Experiments 2 and 3 showed that: 1) people were attracted to an area of darkness when searching and avoided locations close to a window when hiding, 2) when search attempts were limited to three choices, people searched farther from origin and dispersed their locations more when hiding than when searching, and 3) informing people that they would need to recover their hidden objects altered their hiding behavior and increased recovery accuracy. Across all experiments, consistencies in location preferences emerged, with more preference for the middle of the room during hiding and more preference for corners of the room during searching. Even though the same people participated in both the hiding and searching tasks, it appears that people use different strategies to select hiding places than to search for objects hidden by others.


Conflict of interest statement

Competing Interests: The authors have declared that no competing interests exist.

Figures

Figure 1
Figure 1. Screenshot of the real (left panel) and virtual (right panel) rooms used in Experiment 1.
Figure 2
Figure 2. Mean distance from origin (A) and mean perimeter (B) of participant’s choices when hiding (black bars) and searching (grey bars) in both the real and virtual rooms. All distances are in meters.
Figure 3
Figure 3. Proportional difference scores for each bin when hiding (black bars) and searching (grey bars) in the real (A) and virtual (B) rooms in Experiment 1.
Proportional difference scores were calculated by subtracting the proportion of choices observed from the proportion of choices expected given a uniform distribution. The bottom images are schematics of the tile layouts in each room. Each square denotes a tile, and darkened squares indicate the tiles that fell within a given bin.
Figure 4
Figure 4. Proportional difference scores for choices made when searching and hiding.
Scores were calculated by subtracting the proportion of choices made to each bin when searching from the portion of choices made to each bin when hiding. All proportions were normalized to the number of tiles in each bin. The bottom images are schematics of the tile layouts in each room. Each square denotes a tile, and darkened squares indicate the tiles that fell within a given bin.
Figure 5
Figure 5. Mean distance from origin (left bars) and mean perimeter (right bars) traveled by participants when hiding (black bars) and searching (grey bars) in Experiment 2.
All distances are in meters.
Figure 6
Figure 6. Proportional difference scores for hiding and searching in Experiment 2.
(A) Proportional difference scores for hiding (black bars) and searching (grey bars) in each bin in Experiment 2. Proportional difference scores were calculated by subtracting the proportion of choices observed from the proportion of choices expected given a uniform distribution. (B) Proportional difference scores for choices made when searching and hiding. Scores were calculated by subtracting the proportion of choices made to each bin when searching from the portion of choices made to each bin when hiding. All proportions were normalized to the number of tiles in each bin. The bottom images are schematics of the tile layouts in the room. Each square denotes a tile, and darkened squares indicate the tiles that fell within a given bin.
Figure 7
Figure 7. Proportional difference scores for the dark (left bar pair) and window (right bar pair) areas for hiding (black bars) and searching (grey bars) in Experiment 2.
Scores were calculated by subtracting the proportion of choices to the tiles of interest from the proportion of choices to the same tiles in the empty room. The bottom images are schematics of the tile layouts in the room. Each square denotes a tile, and darkened squares indicate the tiles of interest used for comparison to the empty room.
Figure 8
Figure 8. Mean distance from origin (left bar pair) and mean perimeter (right bar pair) traveled by participants when hiding (black bars) and searching (grey bars) in Experiment 3.
All distances are in meters.
Figure 9
Figure 9. Proportional difference scores for hiding and searching in Experiment 2.
(A) Proportional difference scores for hiding (black bars) and searching (grey bars) in each bin in Experiment 3. Proportional difference scores were calculated by subtracting the proportion of choices observed from the proportion of choices expected given a uniform distribution. (B) Proportional difference scores for choices made when searching and hiding. Scores were calculated by subtracting the proportion of choices made to each bin when searching from the proportion of choices made to each bin when hiding. All proportions were normalized to the number of tiles in each bin. The bottom images are schematics of the tile layouts in the room. Each square denotes a tile, and darkened squares indicate the tiles that fell within a given bin.
Figure 10
Figure 10. Proportional difference scores for the dark (left bar pair) and window (right bar pair) areas for hiding (black bars) and searching (grey bars) in Experiment 3.
Scores were calculated by subtracting the proportion of choices to the tiles of interest from the proportion of choices to the same tiles in the empty room. The bottom images are schematics of the tile layouts in the room. Each square denotes a tile, and darkened squares indicate the tiles of interest used for comparison to the empty room.
Figure 11
Figure 11. Proportional difference scores for hiding and searching in Experiment 2.
(A) Proportional difference scores for informed (black bars) and uninformed (grey bars) participants in each bin when hiding in Experiment 3. Proportional difference scores are calculated by subtracting the proportion of choices expected given a uniform distribution from the actual proportion of choices made to each bin. (B) Proportion of location choices made to locations chosen when hiding on participants’ first choice and all three choices in the recovery task. Proportion of correct choices are separated by whether participants were informed (black bars) or uninformed (grey bars).
Figure 12
Figure 12. Figure showing individual tiles chosen by participants on their first choice when hiding (left plots) and searching (right plots) in each experiment.
The shade of grey scale indicates the percentage of first choices that participants made to a given bin.
Figure 13
Figure 13. Figure showing individual tiles chosen by participants on their first choice when hiding (left plot) and searching (right plot) when pooled across all virtual tasks.
The shade of grey scale indicates the percentage of first choices that participants made to a given bin.

Similar articles

Cited by

References

    1. Dally JM, Emery NJ, Clayton NS. Cache protection strategies by western scrub-jays (Aphelocoma californica): Hiding food in the shade. Proc R Soc B. 2004;271:S387–S390. - PMC - PubMed
    1. Dally JM, Emery NJ, Clayton NS. Cache protection strategies by western scrub-jays, Aphelocoma californica: Implications for social cognition. Anim Behav. 2005;70:1251–1263.
    1. Heinrich B, Pepper J. Influence of competitors on caching behaviour in the common raven (Corvus corax). Anim Behav. 1998;56:1083–1090. - PubMed
    1. Elazary L, Itti L. A Bayesian model for efficient visual search and recognition. Vision Res. 2010;50:1338–1352. - PubMed
    1. Wolfe JM, Vo ML-H, Evans KK, Greene MR. Visual search in scenes involves selective and non-selective pathways. Trends Cogn Sci. 2011;15(2):77–84. - PMC - PubMed

Publication types