. 2012;7(5):e37159.
doi: 10.1371/journal.pone.0037159. Epub 2012 May 14.

Gene expression profiling of liver cancer stem cells by RNA-sequencing

Affiliations

Gene expression profiling of liver cancer stem cells by RNA-sequencing

David W Y Ho et al. PLoS One. 2012.

Abstract

Background: Accumulating evidence supports that tumor growth and cancer relapse are driven by cancer stem cells. Our previous work has demonstrated the existence of CD90(+) liver cancer stem cells (CSCs) in hepatocellular carcinoma (HCC). Nevertheless, the characteristics of these cells are still poorly understood. In this study, we employed a more sensitive RNA-sequencing (RNA-Seq) to compare the gene expression profiling of CD90(+) cells sorted from tumor (CD90(+)CSCs) with parallel non-tumorous liver tissues (CD90(+)NTSCs) and elucidate the roles of putative target genes in hepatocarcinogenesis.

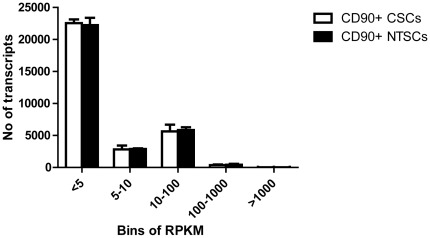
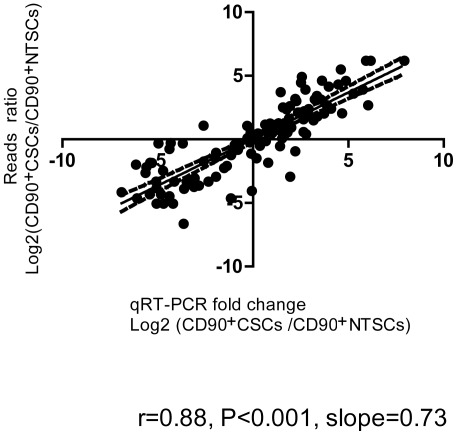
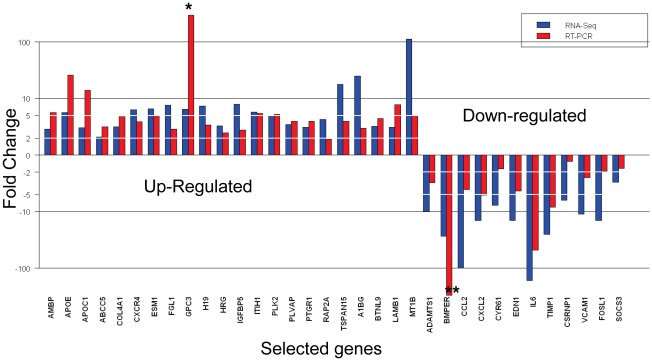
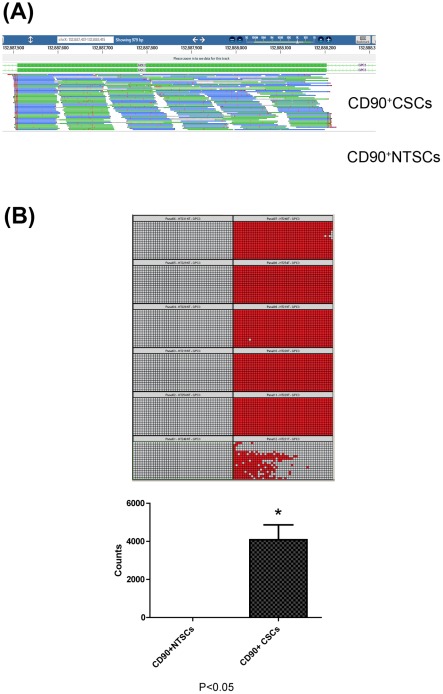
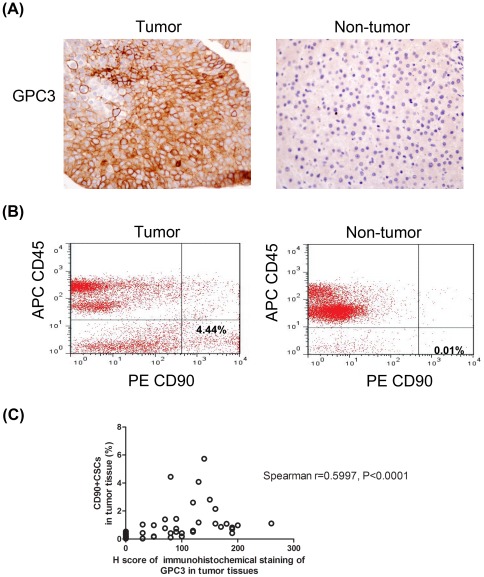
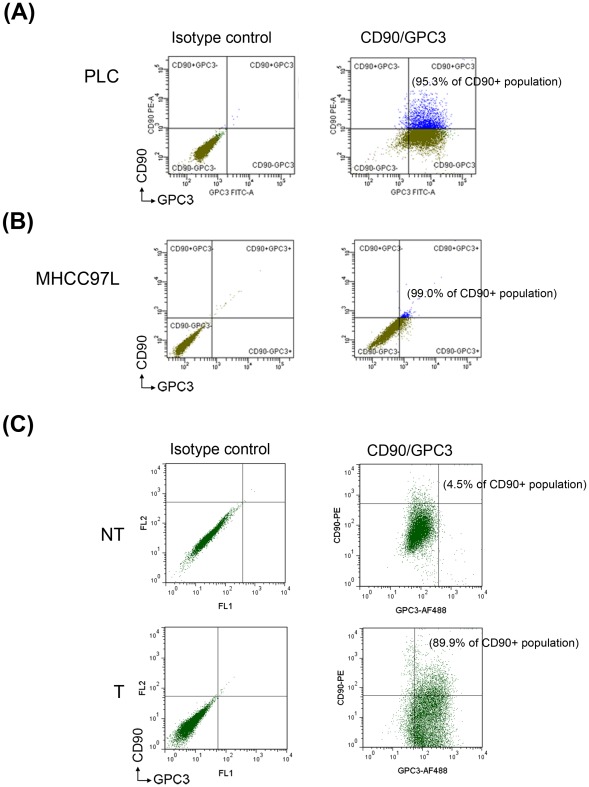
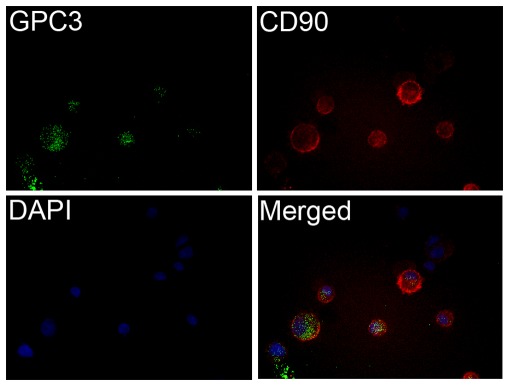
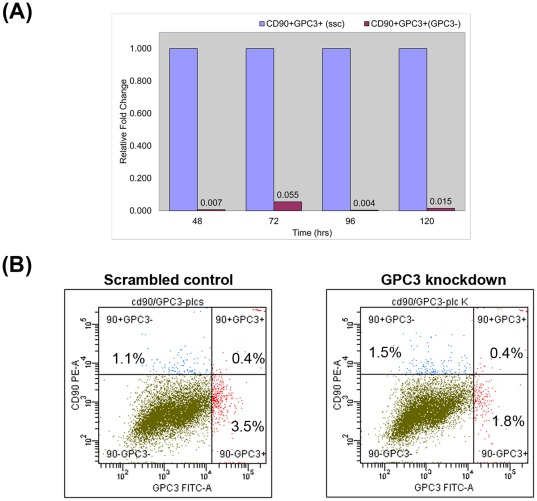
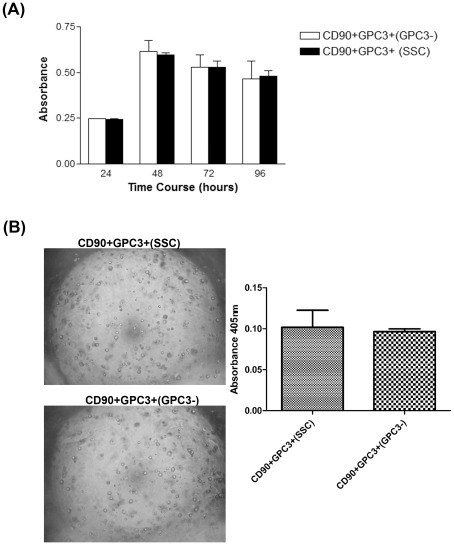
Methodology/principal findings: CD90(+) cells were sorted respectively from tumor and adjacent non-tumorous human liver tissues using fluorescence-activated cell sorting. The amplified RNAs of CD90(+) cells from 3 HCC patients were subjected to RNA-Seq analysis. A differential gene expression profile was established between CD90(+)CSCs and CD90(+)NTSCs, and validated by quantitative real-time PCR (qRT-PCR) on the same set of amplified RNAs, and further confirmed in an independent cohort of 12 HCC patients. Five hundred genes were differentially expressed (119 up-regulated and 381 down-regulated genes) between CD90(+)CSCs and CD90(+)NTSCs. Gene ontology analysis indicated that the over-expressed genes in CD90(+)CSCs were associated with inflammation, drug resistance and lipid metabolism. Among the differentially expressed genes, glypican-3 (GPC3), a member of glypican family, was markedly elevated in CD90(+)CSCs compared to CD90(+)NTSCs. Immunohistochemistry demonstrated that GPC3 was highly expressed in forty-two human liver tumor tissues but absent in adjacent non-tumorous liver tissues. Flow cytometry indicated that GPC3 was highly expressed in liver CD90(+)CSCs and mature cancer cells in liver cancer cell lines and human liver tumor tissues. Furthermore, GPC3 expression was positively correlated with the number of CD90(+)CSCs in liver tumor tissues.

Conclusions/significance: The identified genes, such as GPC3 that are distinctly expressed in liver CD90(+)CSCs, may be promising gene candidates for HCC therapy without inducing damages to normal liver stem cells.


Conflict of interest statement

Competing Interests: The authors have read the journal's policy and have the following conflicts: Some authors are employed by commercial companies. Zhen Fan Yang is employed by AstraZeneca Global R&D; Kang YI, Zhixiang Yan, Hang Liu and Yong Zhang are employees of BGI-Shenzhen. This does not alter the authors adherence to all the PLoS ONE policies on sharing data and materials.

Figures

Figure 1
Figure 1. Bar chart showing the number of reads at different levels.
Y-axis, number of reads; X-axis, bins of expression levels (bins at <5 RPKM, 5–10 RPKM, 11–100 RPKM, 100–1000 RPKM and >1000 RPKM). The majority of the transcripts were expressed at low levels (<5 RPKM). RPKM, reads per kilobase per million of reads.
Figure 2
Figure 2. Correlation between qRT-PCR and RNA-Seq data.
Correlation between qRT-PCR and RNA-Seq data of 47 selected genes: 28 up-regulated genes and 19 down-regulated genes in 3 pairs of amplified RNA samples. Spearman Rank Correlation coefficient = 0.88 (P<0.001) and slope = 0.73.
Figure 3
Figure 3. Prospective validation of RNA-Seq analysis using an independent cohort of 12 patients by qRT-PCR.
Twenty-seven up-regulated genes and 15 down-regulated genes were selected for validation. The fold changes of selected genes measured by qRT-PCR were statistically significant (P<0.05). Gene expression difference was considered to be valid if the direction of change was the same (as estimated by RNA-Seq analysis). The percentage of concordance of qRT-PCR with the change of direction estimated by RNA-Seq analysis for the selected genes was 80%. *: The expression of GPC3 in CD90+NTSCs was not detected and its fold change could not be calculated. Further analysis by Fluidigm digital array confirmed the finding. **: The expression of BMPER in CD90+CSCs was not detected. Further analysis by Fludigim digital array confirmed the finding.
Figure 4
Figure 4. Read distribution along the GPC3 gene and quantitative measurement of mRNA GPC3 by Fluidigm digital array assay.
(A) Alignment of RNA-Seq sequence reads to GPC3 gene. Significantly higher read counts were detected for CD90+CSCs when compared with those of CD90+NTSCs, indicating the specificity of GPC3 in liver CD90+CSCs. For illustration purpose, only one exon of the gene was shown. (B) Each digital array chip can run twelve samples. The six samples of the right hand side of the chip were CD90+CSCs, and of the left hand side were the corresponding CD90+NTSCs. Digital array partitioned a RNA sample premixed with RT-PCR reagents into individual 765 RT-PCR reactions. In each partition, the red color indicated positive expression of GPC3 at mRNA level, whereas grey indicated no expression. The GPC3 mRNA level was quantified by counting the positive signals by the software. The mRNA expression of GPC3 was predominantly expressed in CD90+CSCs as compared with CD90+NTSCs (P<0.05).
Figure 5
Figure 5. GPC3 expression and quantification of CD90+ cells in human liver tumor tissues.
(A) Immunohistochemistry detected strong signals of GPC3 in liver tumor tissue, but negative staining for GPC3 was detected in the adjacent non-tumorous tissue (magnification×200). (B) Flow cytometry detected more CD45CD90+ cells in tumor tissues (median, 0.645%; range, 0.06–4.59% of the gated cells) than that in adjacent non-tumorous tissues (median, 0.175%; range, 0.00–1.14%). (C) The number of CD45CD90+cells was positively correlated with GPC3 expression level in the tumor tissues (Spearman correlation coefficient = 0.5997, P<0.0001).
Figure 6
Figure 6. High prevalence of CD90+GPC3+ cells in CD90+CSCs derived from human HCC cell lines and liver tumors.
A significant increase in the number of CD90+GPC3+ cells were detected within CD90+ cell population of PLC and MHCC97L cells. (A) In PLC cells, 95.3% of CD90+ cells co-expressed GPC3. (B) In MHCC97L cells, 99.0% of CD90+ cells co-expressed GPC3. (C) Analysis of a representative pair of human liver tissues indicated that only 4.5% of CD90+ population expressed GPC3 in non-tumorous tissues, while 89.9% of CD90+ cells expressed GPC3 in the matched tumorous tissues (median, 86.4%; range, 54.2–91.0%; n = 5). These results demonstrated that GPC3 is distinctly expressed in liver CD90+CSCs.
Figure 7
Figure 7. Double immunofluorescence staining of CD90 and GPC3 in sorted PLC CD90+GPC3+ cells.
The sorted cells were stained with fluorescein-conjugated anti-CD90 and anti-GPC3 antibodies. Nuclei were counterstained by DAPI. The merge image showed the expression of CD90 and GPC3 in both cytoplasm and cell membrane.
Figure 8
Figure 8. Effective knockdown of GPC3 in PLC CD90+GPC3+ cells.
The sorted PLC CD90+GPC3+ cells were transfected with either 20 nM specific GPC3 siRNA or a scrambled siRNA control and incubated for 24 hours. (A) GPC3 knockdown in the target cells reduced the gene expression by 90% as measured by qRT-PCR. (B) By flow cytometry, the number of GPC3-expressing cells was decreased by 43% upon GPC3 knockdown when compared to the scrambled control (decreased from 3.9% to 2.2%).
Figure 9
Figure 9. Effect of GPC3 on cell proliferation and clonogenic capacity of liver CD90+GPC3+CSCs.
(A) Cell proliferation was assessed after GPC3 knockdown in PLC CD90+GPC3+ cancer stem cells. No significant effect of GPC3 on liver cancer stem cell proliferation was found. (B) Knockdown of GPC3 in PLC CD90+GPC3+ cancer stem cells by siRNA did not affect their colony formation ability, indicating that GPC3 had no impact on clonogenicity of the liver cancer stem cells.

Similar articles

Cited by

References

    1. Thorgeirsson SS, Grisham JW. Molecular pathogenesis of human hepatocellular carcinoma. Nat Genet. 2002;31:339–346. - PubMed
    1. Lo CM, Ngan H, Tso WK, Liu CL, Lam CM, et al. Randomized controlled trial of transarterial lipiodol chemoembolization for unresectable hepatocellular carcinoma. Hepatology. 2002;35:1164–1171. - PubMed
    1. Ma S, Jiao B, Liu X, Yi H, Kong D, et al. Cancer Treat Rev; 2009. Approach to radiation therapy in hepatocellular carcinoma. - PubMed
    1. Poon RT, Fan ST, Lo CM, Ng IO, Liu CL, et al. Improving survival results after resection of hepatocellular carcinoma: a prospective study of 377 patients over 10 years. Ann Surg. 2001;234:63–70. - PMC - PubMed
    1. Abou-Alfa GK. Hepatocellular carcinoma: molecular biology and therapy. Semin Oncol. 2006;33:S79–83. - PMC - PubMed

Publication types

MeSH terms