

Cluster analysis of host cytokine responses to biodefense pathogens in a whole blood ex vivo exposure model (WEEM)
- PMID: 22607329
- PMCID: PMC3430575
- DOI: 10.1186/1471-2180-12-79
Cluster analysis of host cytokine responses to biodefense pathogens in a whole blood ex vivo exposure model (WEEM)
Abstract
Background: Rapid detection and therapeutic intervention for infectious and emerging diseases is a major scientific goal in biodefense and public health. Toward this end, cytokine profiles in human blood were investigated using a human whole blood ex vivo exposure model, called WEEM.
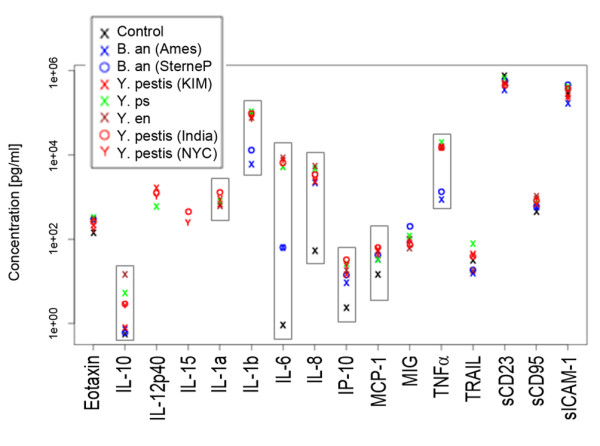
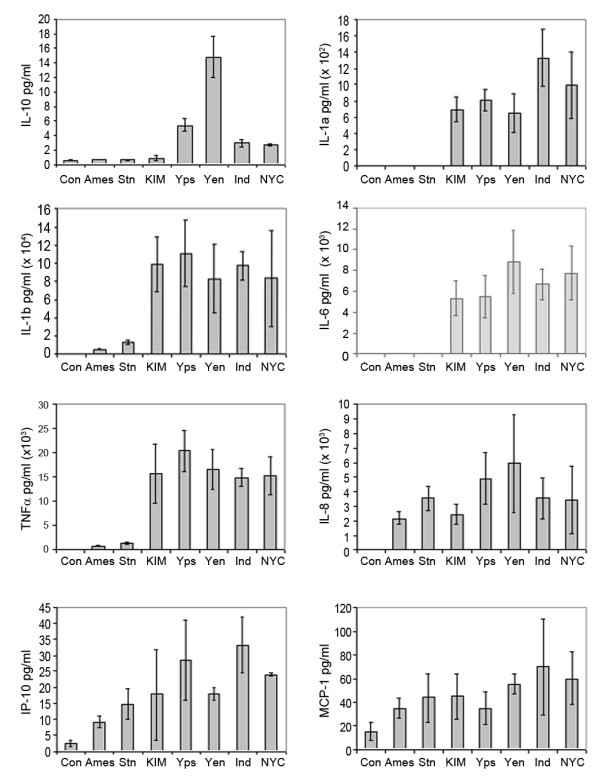
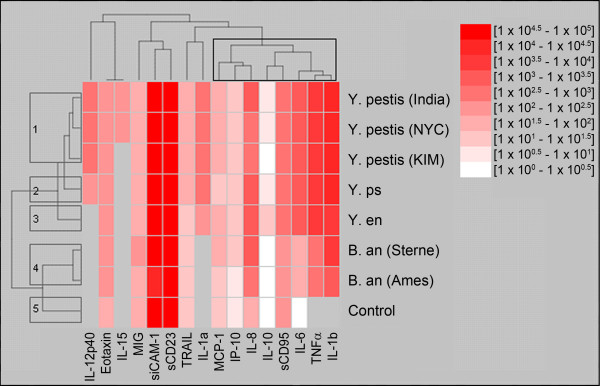
Results: Samples of whole blood from healthy volunteers were incubated with seven pathogens including Yersinia pseudotuberculosis, Yersinia enterocolitica, Bacillus anthracis, and multiple strains of Yersinia pestis, and multiplexed protein expression profiling was conducted on supernatants of these cultures with an antibody array to detect 30 cytokines simultaneously. Levels of 8 cytokines, IL-1α, IL-1β, IL-6, IL-8, IL-10, IP-10, MCP-1 and TNFα, were significantly up-regulated in plasma after bacterial exposures of 4 hours. Statistical clustering was applied to group the pathogens based on the host response protein expression profiles. The nearest phylogenetic neighbors clustered more closely than the more distant pathogens, and all seven pathogens were clearly differentiated from the unexposed control. In addition, the Y. pestis and Yersinia near neighbors were differentiated from the B. anthracis strains.
Conclusions: Cluster analysis, based on host response cytokine profiles, indicates that distinct patterns of immunomodulatory proteins are induced by the different pathogen exposures and these patterns may enable further development into biomarkers for diagnosing pathogen exposure.
Figures
Similar articles
-
Subcellular proteomic analysis of host-pathogen interactions using human monocytes exposed to Yersinia pestis and Yersinia pseudotuberculosis.Proteomics. 2005 May;5(7):1877-88. doi: 10.1002/pmic.200401083. Proteomics. 2005. PMID: 15825148
-
Proteomic characterization of host response to Yersinia pestis and near neighbors.Biochem Biophys Res Commun. 2004 Jul 23;320(2):474-9. doi: 10.1016/j.bbrc.2004.05.199. Biochem Biophys Res Commun. 2004. PMID: 15219853
-
A new asset for pathogen informatics--the Enteropathogen Resource Integration Center (ERIC), an NIAID Bioinformatics Resource Center for Biodefense and Emerging/Re-emerging Infectious Disease.Adv Exp Med Biol. 2007;603:28-42. doi: 10.1007/978-0-387-72124-8_4. Adv Exp Med Biol. 2007. PMID: 17966403
-
The yersiniae--a model genus to study the rapid evolution of bacterial pathogens.Nat Rev Microbiol. 2003 Oct;1(1):55-64. doi: 10.1038/nrmicro730. Nat Rev Microbiol. 2003. PMID: 15040180 Review.
-
Applications of docking and molecular dynamic studies on the search for new drugs against the biological warfare agents Bacillus anthracis and Yersinia pestis.Curr Comput Aided Drug Des. 2013 Dec;9(4):507-17. doi: 10.2174/15734099113099990033. Curr Comput Aided Drug Des. 2013. PMID: 24341424 Review.
Cited by
-
Picornavirus-Induced Airway Mucosa Immune Profile in Asymptomatic Neonates.J Infect Dis. 2016 Apr 15;213(8):1262-70. doi: 10.1093/infdis/jiv594. Epub 2015 Dec 9. J Infect Dis. 2016. PMID: 26655299 Free PMC article.
-
Human and animal isolates of Yersinia enterocolitica show significant serotype-specific colonization and host-specific immune defense properties.Infect Immun. 2013 Nov;81(11):4013-25. doi: 10.1128/IAI.00572-13. Epub 2013 Aug 19. Infect Immun. 2013. PMID: 23959720 Free PMC article.
References
Publication types
MeSH terms
Substances
LinkOut - more resources
Full Text Sources
Medical
Miscellaneous
