

RuleBender: integrated modeling, simulation and visualization for rule-based intracellular biochemistry
- PMID: 22607382
- PMCID: PMC3355338
- DOI: 10.1186/1471-2105-13-S8-S3
RuleBender: integrated modeling, simulation and visualization for rule-based intracellular biochemistry
Abstract
Background: Rule-based modeling (RBM) is a powerful and increasingly popular approach to modeling cell signaling networks. However, novel visual tools are needed in order to make RBM accessible to a broad range of users, to make specification of models less error prone, and to improve workflows.
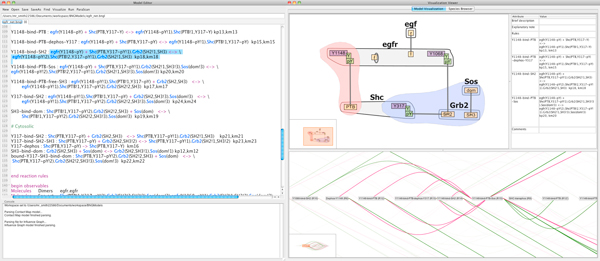
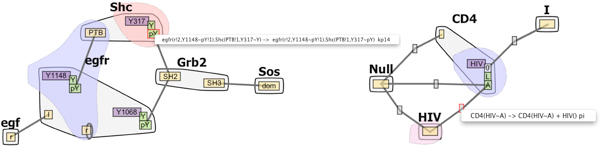
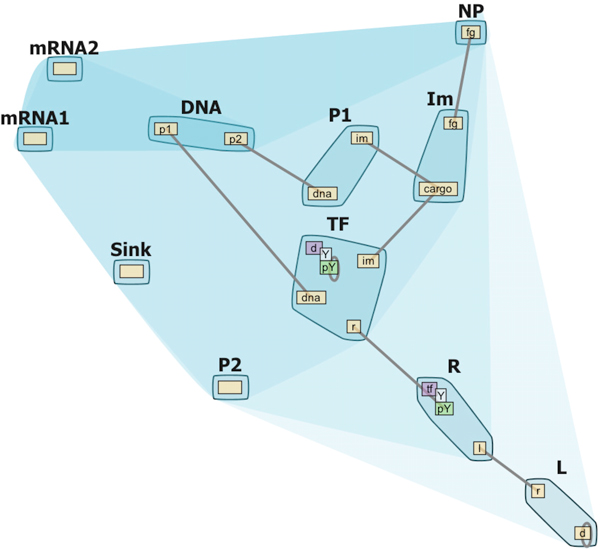
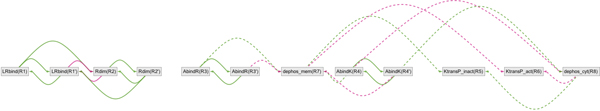
Results: We introduce RuleBender, a novel visualization system for the integrated visualization, modeling and simulation of rule-based intracellular biochemistry. We present the user requirements, visual paradigms, algorithms and design decisions behind RuleBender, with emphasis on visual global/local model exploration and integrated execution of simulations. The support of RBM creation, debugging, and interactive visualization expedites the RBM learning process and reduces model construction time; while built-in model simulation and results with multiple linked views streamline the execution and analysis of newly created models and generated networks.
Conclusion: RuleBender has been adopted as both an educational and a research tool and is available as a free open source tool at http://www.rulebender.org. A development cycle that includes close interaction with expert users allows RuleBender to better serve the needs of the systems biology community.
Figures
Similar articles
-
RuleBender: a visual interface for rule-based modeling.Bioinformatics. 2011 Jun 15;27(12):1721-2. doi: 10.1093/bioinformatics/btr197. Epub 2011 Apr 14. Bioinformatics. 2011. PMID: 21493655 Free PMC article.
-
Modeling biochemical transformation processes and information processing with Narrator.BMC Bioinformatics. 2007 Mar 27;8:103. doi: 10.1186/1471-2105-8-103. BMC Bioinformatics. 2007. PMID: 17389034 Free PMC article.
-
ProteoLens: a visual analytic tool for multi-scale database-driven biological network data mining.BMC Bioinformatics. 2008 Aug 12;9 Suppl 9(Suppl 9):S5. doi: 10.1186/1471-2105-9-S9-S5. BMC Bioinformatics. 2008. PMID: 18793469 Free PMC article.
-
Visualization in simulation tools: requirements and a tool specification to support the teaching of dynamic biological processes.J Bioinform Comput Biol. 2011 Aug;9(4):579-95. doi: 10.1142/s0219720011005410. J Bioinform Comput Biol. 2011. PMID: 21776610 Review.
-
Biological Network Inference and analysis using SEBINI and CABIN.Methods Mol Biol. 2009;541:551-76. doi: 10.1007/978-1-59745-243-4_24. Methods Mol Biol. 2009. PMID: 19381531 Review.
Cited by
-
Stoichiometric balance of protein copy numbers is measurable and functionally significant in a protein-protein interaction network for yeast endocytosis.PLoS Comput Biol. 2018 Mar 8;14(3):e1006022. doi: 10.1371/journal.pcbi.1006022. eCollection 2018 Mar. PLoS Comput Biol. 2018. PMID: 29518071 Free PMC article.
-
NetworkViewer: visualizing biochemical reaction networks with embedded rendering of molecular interaction rules.BMC Syst Biol. 2014 Jun 16;8:70. doi: 10.1186/1752-0509-8-70. BMC Syst Biol. 2014. PMID: 24934175 Free PMC article.
-
The Kappa platform for rule-based modeling.Bioinformatics. 2018 Jul 1;34(13):i583-i592. doi: 10.1093/bioinformatics/bty272. Bioinformatics. 2018. PMID: 29950016 Free PMC article.
-
THALIS: Human-Machine Analysis of Longitudinal Symptoms in Cancer Therapy.IEEE Trans Vis Comput Graph. 2022 Jan;28(1):151-161. doi: 10.1109/TVCG.2021.3114810. Epub 2021 Dec 24. IEEE Trans Vis Comput Graph. 2022. PMID: 34591766 Free PMC article.
-
Recent progress using systems biology approaches to better understand molecular mechanisms of immunity.Semin Immunol. 2013 Oct 31;25(3):201-8. doi: 10.1016/j.smim.2012.11.002. Epub 2012 Dec 11. Semin Immunol. 2013. PMID: 23238271 Free PMC article. Review.
References
-
- Chabrier N, Chiaverini M, Danos V, Fages F, Schächter V. Modeling and Querying Molecular interaction networks. 2004.
-
- Faeder JR, Blinov ML, Hlavacek WS. Proceedings of the 2005 ACM symposium on Applied computing. SAC '05, New York, NY, USA: ACM; 2005. Graphical rule-based representation of signal-transduction networks; pp. 133–140.
-
- Danos V, Feret J, Fontana W, Krivine J. Scalable simulation of cellular signaling networks. In Proceedings of APLAS, 2007. 2007. pp. 139–157.
Publication types
MeSH terms
Grants and funding
LinkOut - more resources
Full Text Sources
