

Rate of gestational weight gain, pre-pregnancy body mass index and preterm birth subtypes: a retrospective cohort study from Peru
- PMID: 22607522
- PMCID: PMC4112735
- DOI: 10.1111/j.1471-0528.2012.03345.x
Rate of gestational weight gain, pre-pregnancy body mass index and preterm birth subtypes: a retrospective cohort study from Peru
Abstract
Objective: To examine the shape (functional form) of the association between the rate of gestational weight gain, pre-pregnancy body mass index (BMI), and preterm birth and its subtypes.
Design: Retrospective cohort study.
Setting: National reference obstetric centre in Lima, Peru.
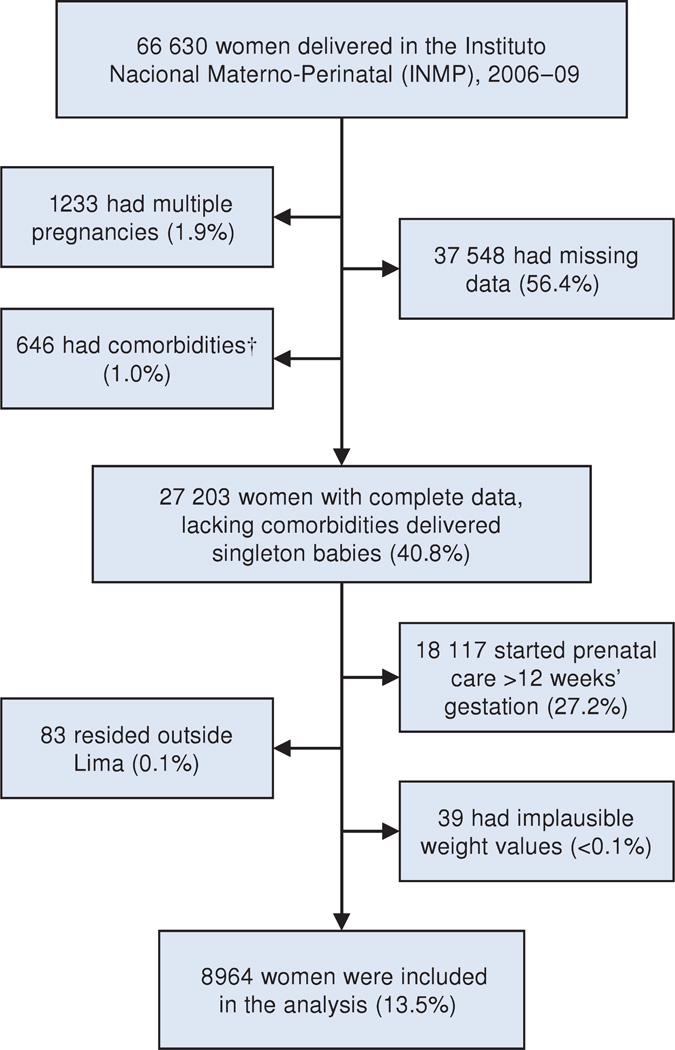
Population: Pregnant women who delivered singleton babies during the period 2006-2009, resident in Lima, and beginning prenatal care at ≤ 12 weeks of gestation (n=8964).
Methods: Data were collected from the centre database. The main analyses consisted of logistic regression with fractional polynomial modelling.
Main outcome measures: Preterm birth and its subtypes.
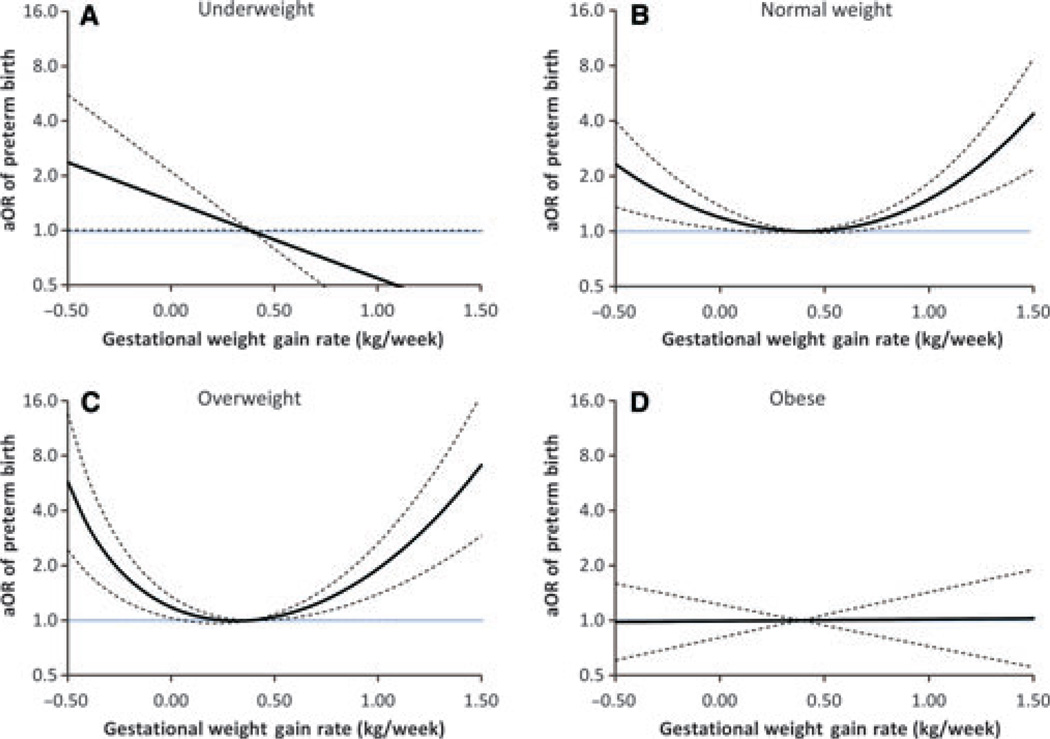
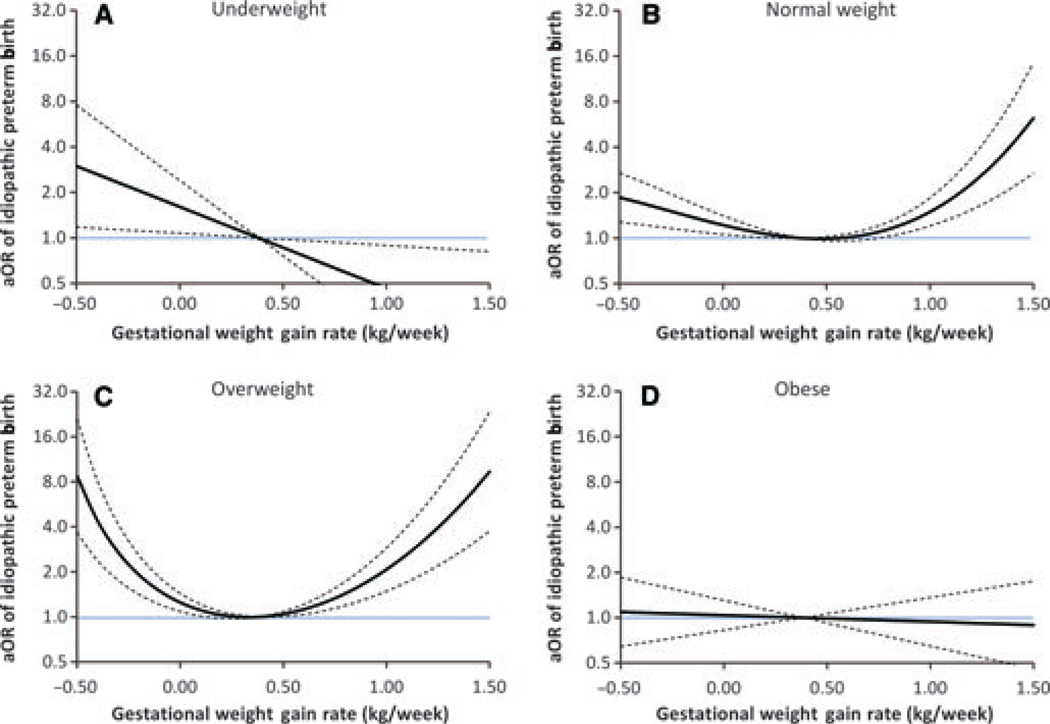
Results: Preterm birth occurred in 12.2% of women, being mostly idiopathic (85.7%). The rate of gestational weight gain was independently associated with preterm birth, and the shape of this association varied by pre-pregnancy BMI. In women who were underweight, the association was linear (per 0.1 kg/week increase) and protective (OR 0.88; 95% CI 0.82-1.00). In women of normal weight or who were overweight, the association was U-shaped: the odds of delivering preterm increased exponentially with rates <0.10 or >0.66 kg/week, and <0.04 or >0.50 kg/week, respectively. In women who were obese, the association was linear, but non-significant (OR 1.01; 95% CI 0.95-1.06). The association described for preterm birth closely resembled that of idiopathic preterm birth, although the latter was stronger. The rate of gestational weight gain was not associated with indicated preterm birth or preterm prelabour rupture of membranes.
Conclusions: In Peruvian pregnant women starting prenatal care at ≤ 12 weeks of gestation, the rate of gestational weight gain is independently associated with preterm birth, mainly because of its association with idiopathic preterm birth, and the shape of both associations varies by pre-pregnancy BMI.
© 2012 The Authors BJOG An International Journal of Obstetrics and Gynaecology © 2012 RCOG.
Figures
Similar articles
-
Rate of gestational weight gain and preterm birth in relation to prepregnancy body mass indices and trimester: a follow-up study in China.Reprod Health. 2016 Aug 12;13(1):93. doi: 10.1186/s12978-016-0204-2. Reprod Health. 2016. PMID: 27519645 Free PMC article.
-
Pre-pregnancy BMI and weight gain: where is the tipping point for preterm birth?BMC Pregnancy Childbirth. 2013 May 24;13:120. doi: 10.1186/1471-2393-13-120. BMC Pregnancy Childbirth. 2013. PMID: 23706121 Free PMC article.
-
Association of Pre-Pregnancy Body Mass Index and Gestational Weight Gain with Preterm Births and Fetal Size: an Observational Study from Lebanon.Paediatr Perinat Epidemiol. 2016 Jan;30(1):38-45. doi: 10.1111/ppe.12249. Epub 2015 Oct 15. Paediatr Perinat Epidemiol. 2016. PMID: 26469281
-
Association between perinatal outcomes and maternal pre-pregnancy body mass index.Obes Rev. 2016 Nov;17(11):1091-1102. doi: 10.1111/obr.12455. Epub 2016 Aug 18. Obes Rev. 2016. PMID: 27536879 Review.
-
The relationship between preterm birth and underweight in Asian women.Reprod Toxicol. 2015 Aug 15;56:170-4. doi: 10.1016/j.reprotox.2015.03.005. Epub 2015 Mar 20. Reprod Toxicol. 2015. PMID: 25801177 Review.
Cited by
-
Association of prepregnancy body mass index, rate of gestational weight gain with pregnancy outcomes in Chinese urban women.Nutr Metab (Lond). 2019 Aug 19;16:54. doi: 10.1186/s12986-019-0386-z. eCollection 2019. Nutr Metab (Lond). 2019. PMID: 31452666 Free PMC article.
-
Timing and Amount of Gestational Weight Gain in Association with Adverse Birth Outcomes.Epidemiology. 2019 Sep;30(5):695-705. doi: 10.1097/EDE.0000000000001055. Epidemiology. 2019. PMID: 31205288 Free PMC article.
-
A review of maternal overweight and obesity and its impact on cardiometabolic outcomes during pregnancy and postpartum.Ther Adv Reprod Health. 2021 Feb 4;15:2633494120986544. doi: 10.1177/2633494120986544. eCollection 2021 Jan-Dec. Ther Adv Reprod Health. 2021. PMID: 33615227 Free PMC article. Review.
-
Pre-pregnancy BMI, rate of gestational weight gain, and preterm birth among US Pacific Islander individuals.Obesity (Silver Spring). 2024 Apr;32(4):798-809. doi: 10.1002/oby.23979. Epub 2024 Feb 2. Obesity (Silver Spring). 2024. PMID: 38304993 Free PMC article.
-
Rate of gestational weight gain and preterm birth in relation to prepregnancy body mass indices and trimester: a follow-up study in China.Reprod Health. 2016 Aug 12;13(1):93. doi: 10.1186/s12978-016-0204-2. Reprod Health. 2016. PMID: 27519645 Free PMC article.
References
-
- Lumley J. Defining the problem: the epidemiology of preterm birth. BJOG. 2003;110:3–7. - PubMed
-
- Lawn J, Cousens S, Zupan J. 4 million neonatal deaths: When? Where? Why? Lancet. 2005. 365:891–900. - PubMed
-
- Black RE, Cousens S, Johnson HL, Lawn JE, Rudan I, Bassani DG, et al. Global, regional, and national causes of child mortality in 2008: a systematic analysis. Lancet. 2010;375:1969–1987. - PubMed
-
- Saigal S, Doyle LW. An overview of mortality and sequelae of preterm birth from infancy to adulthood. Lancet. 2008;371:261–269. - PubMed
MeSH terms
Grants and funding
LinkOut - more resources
Full Text Sources
