. 2012 May 25;46(4):424-35.
doi: 10.1016/j.molcel.2012.03.030. Epub 2012 May 17.

Clustered mutations in yeast and in human cancers can arise from damaged long single-strand DNA regions

Affiliations

Clustered mutations in yeast and in human cancers can arise from damaged long single-strand DNA regions

Steven A Roberts et al. Mol Cell. .

Abstract

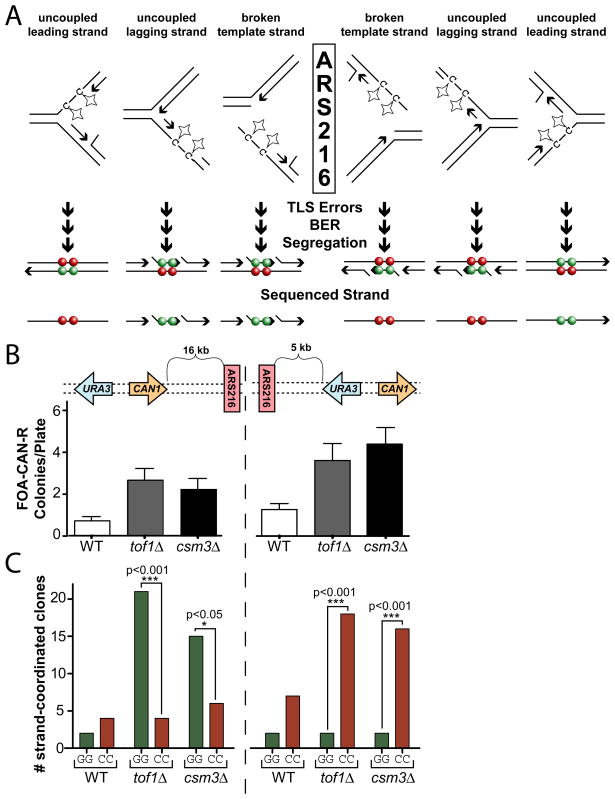
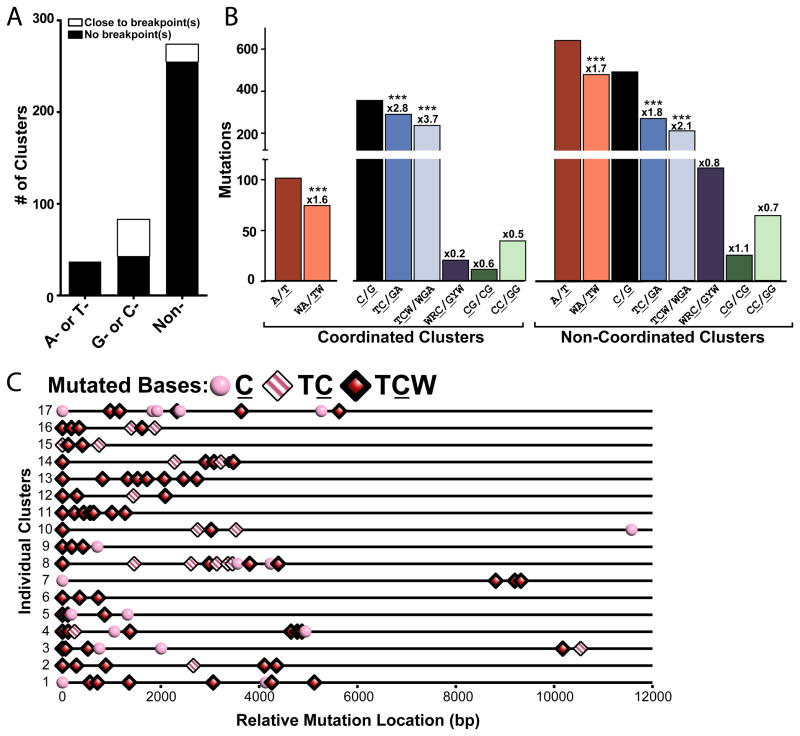
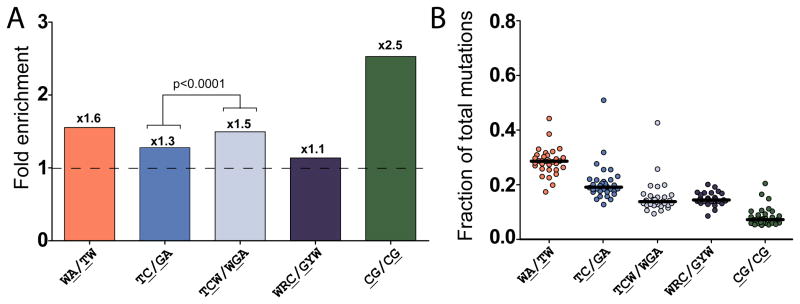
Mutations are typically perceived as random, independent events. We describe here nonrandom clustered mutations in yeast and in human cancers. Genome sequencing of yeast grown under chronic alkylation damage identified mutation clusters that extend up to 200 kb. A predominance of "strand-coordinated" changes of either cytosines or guanines in the same strand, mutation patterns, and genetic controls indicated that simultaneous mutations were generated by base alkylation in abnormally long single-strand DNA (ssDNA) formed at double-strand breaks (DSBs) and replication forks. Significantly, we found mutation clusters with analogous features in sequenced human cancers. Strand-coordinated clusters of mutated cytosines or guanines often resided near chromosome rearrangement breakpoints and were highly enriched with a motif targeted by APOBEC family cytosine-deaminases, which strongly prefer ssDNA. These data indicate that hypermutation via multiple simultaneous changes in randomly formed ssDNA is a general phenomenon that may be an important mechanism producing rapid genetic variation.


Figures

Figure 1
Figure 1
Multiple Mutation Reporters. Presented are yeast strains with URA3 (blue) and CAN1 (orange) separated by either 0.9 kb inserted into LYS2 (adjacent reporters) to the left (A) or right (B) of ARS216 (red) on chromosome II or by 83 kb on the left arm of chromosome V (separated reporters; C). Isolates that were mutant in both genes were selected by resistance to the drugs 5-FOA and canavanine.
Figure 2
Figure 2
Selection and Characterization of Mutation Clusters. FOA-CAN mutation frequencies for wild type haploid (1n) and diploid (2n) yeast carrying the adjacent (Adj) or separated (Sep) URA3-CAN1 reporters (see Figure 1 reporters A and C). Selected isolates were sequenced. (A) The median number of colonies/plate. Error bars indicate 95% confidence intervals (CI). “ALL” represents colonies from MAT a/α, α/α, and a/a combined. LOH adjusted values are indicated (see also Table S2, Supplemental text). (B) An example FOA-CAN resistant genome (named Cra3): gray bars represent each of the 16 yeast chromosomes, the red line indicates the location of URA3 and CAN1, and blue lines denote the position of mutations. A segment of chromosome II containing a mutation cluster is enlarged. Cluster lengths (C), the number of mutations per cluster (D), and Cluster P-values (E) of all sequenced chromosome II clusters arising from cells treated with 2 (white circles) or 4 mM (gray circles) are presented. Black circles indicate unselected clusters. Solid lines indicate median values.
Figure 3
Figure 3
MMS-induced Mutated Base Pairs. The total mutated A:T and C:G base pairs in FOA-CAN dually resistant wild type haploid and diploid yeast carrying the URA3-CAN1 reporter selected after 2 day exposure to 2 or 4 mM MMS were divided based upon whether they were clustered (C) or scattered (S). “N” indicates scattered mutations for isolates where no FOA-CAN selection was applied. Mutations in URA3 and CAN1 as well as annotated repeat regions including LTRs and retrotransposons were excluded from totals. P-values were determined with two-sided Fisher’s Exact Test (see also Figure S2).
Figure 4
Figure 4
Strand-Coordination of Clustered Mutations. Each line (numbers represent the Dataset Cluster ID from Table S4B) depicts the mutated cytosines (red circles) and guanines (green circles) in the sequenced strand of a FOA-CAN selected cluster containing more than 3 guanines and/or cytosines originating from the indicated wild type strains carrying the adjacent URA3-CAN1 reporter treated with either 2 or 4 mM MMS. Only mutations at C and G bases are depicted. The complete mutation data, including the mutations at A and T bases, is presented in Figure S1 and Table S4B. Clusters are separated into two categories (A) non-switching clusters and (B) switching clusters. A coordination switch is defined as 2 or more consecutive coordinated mutations followed by at least 2 consecutive coordinated mutations of the opposite base. Approximate break points are indicated by arrows. Within categories, clusters are sorted by genotype, MMS treatment and finally by cluster length. Clusters labeled with Dataset Cluster IDs 131,148 and 152 are presented as a subpanel within (A) since they require a significantly different scale than the remaining non-switching clusters. (C) Model of MMS induced clusters caused by N3-methyl cytosine adducts in the single-strand overhangs of resected DSBs.
Figure 5
Figure 5
Replication-Associated Clusters. (A) Possible causes of ssDNA at dysfunctional forks. Breakage of the leading strand template would produce a similar outcome as breakage of the lagging strand template and thus is omitted for simplicity. Expected biases of mutated cytosines (red circles) and/or guanines (green circles) in the sequenced strand depend on their location relative to the replication origin. (B) FOA-CAN mutation frequencies induced with 2 mM MMS. Error bars indicate 95% CI. (C) The URA3 and CAN1 open reading frames of selected clones from (B) were PCR amplified and Sanger sequenced. Isolates containing G-G or C-C strand coordinated mutations were tabulated. P-values were calculated by 2-tailed g test for goodness-of-fit to an expected 1:1 ratio.
Figure 6
Figure 6
Mutation Clusters in Sequenced Human Cancers. (A) Mutation clusters in non-SHM regions separated by type of strand-coordination (“A- or T-” coordinated, “G- or C-” coordinated, and “non-” coordinated). White bars indicate the number of clusters co-localized with breakpoint(s). Co-localization was registered when the region covered by the cluster plus left and right flanks of 20,000 nucleotides contained at least one breakpoint. Black bars depict the number of clusters not associated with a specific breakpoint. (B) Number of mutations from the coordination classes in (A) that occurred within specific sequence motifs. Numbers above bars indicate the fold enrichment of clustered mutations occurring at a motif over the frequency of the motif occurs in the chromosomal sequence that the cluster spans (See Cluster Sequence in Table S9). Asterisks demark motifs significantly enriched in mutation clusters (P-value <0.0001) as determined by Chi-square (See also Figures S3). (C) Distribution of mutations within 17 C-coordinated clusters with greater than 3 mutations. Mutated cytosines are categorized by their presence in a TC motif (pink and white striped diamonds), TCW motif (red diamonds), or no identified motif (pink circles).
Figure 7
Figure 7
Genome-wide Prevalence of Mutated Motifs in Sequenced Human Cancers. (A) Median fold enrichment of genome-wide mutations at various motifs (motifs identified in clusters plus CpG - CG/CG and the AID target motif – WRC/GYW). Numbers above bars indicate the fold enrichment of mutations occurring at a motif over the frequency of the motif in a fraction of sequence representative of the each genome. The enrichments of TC/GA and TCW/WGA also were compared by Wilcoxon signed rank test. (B) Fraction of total mutations occurring at the motifs described in (A) for individual sequenced tumors (circles). The horizontal bar indicates the median value (see also Figure S4).

Comment in

References

    1. Aguilera A. The connection between transcription and genomic instability. Embo J. 2002;21:195–201. - PMC - PubMed
    1. Bando M, Katou Y, Komata M, Tanaka H, Itoh T, Sutani T, Shirahige K. Csm3, Tof1, and Mrc1 form a heterotrimeric mediator complex that associates with DNA replication forks. J Biol Chem. 2009;284:34355–34365. - PMC - PubMed
    1. Beale RC, Petersen-Mahrt SK, Watt IN, Harris RS, Rada C, Neuberger MS. Comparison of the differential context-dependence of DNA deamination by APOBEC enzymes: correlation with mutation spectra in vivo. J Mol Biol. 2004;337:585–596. - PubMed
    1. Beranek DT. Distribution of methyl and ethyl adducts following alkylation with monofunctional alkylating agents. Mutat Res. 1990;231:11–30. - PubMed
    1. Berger MF, Lawrence MS, Demichelis F, Drier Y, Cibulskis K, Sivachenko AY, Sboner A, Esgueva R, Pflueger D, Sougnez C, et al. The genomic complexity of primary human prostate cancer. Nature. 2011;470:214–220. - PMC - PubMed

Publication types