. 2012 Jun 6;15(6):885-94.
doi: 10.1016/j.cmet.2012.04.018. Epub 2012 May 17.

Adenosine signaling promotes regeneration of pancreatic β cells in vivo

Affiliations

Adenosine signaling promotes regeneration of pancreatic β cells in vivo

Olov Andersson et al. Cell Metab. .

Abstract

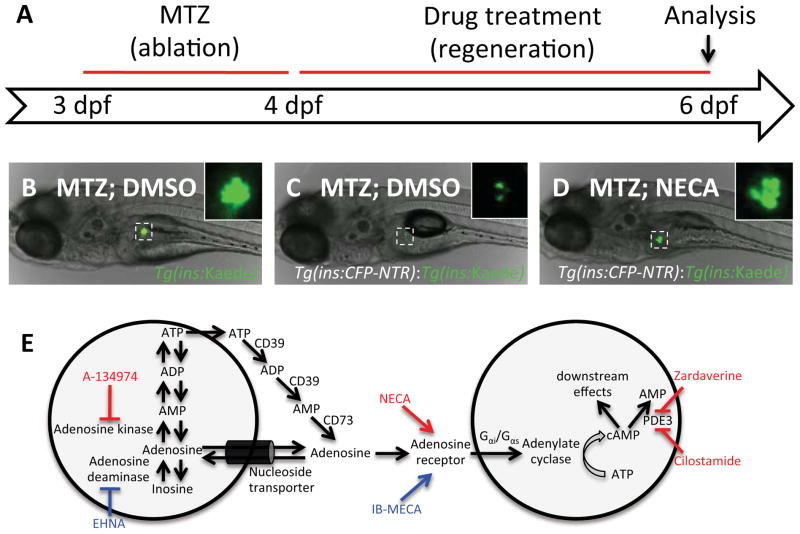
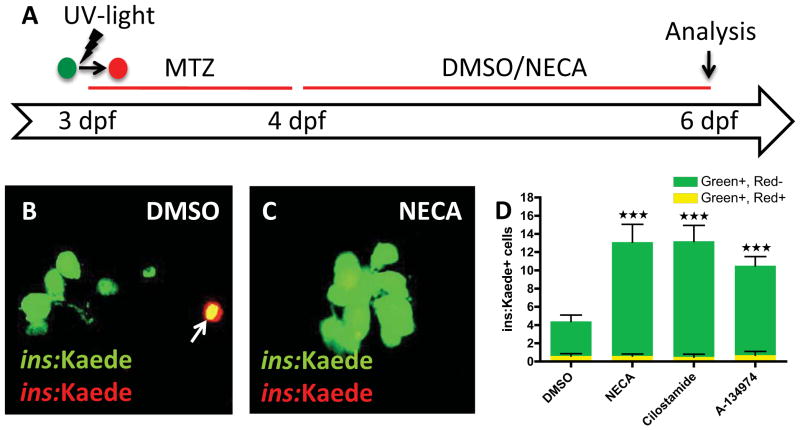
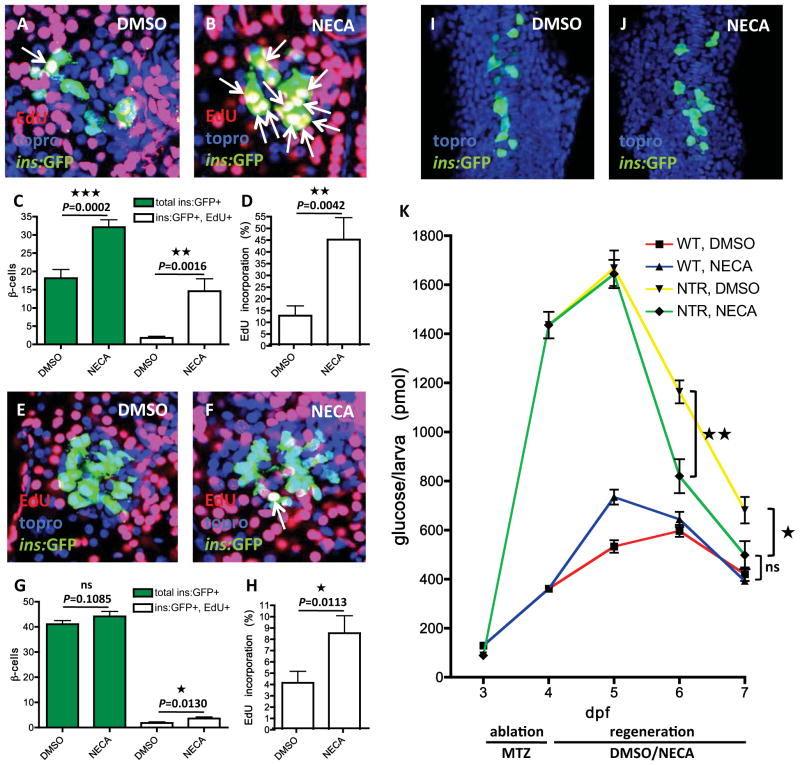
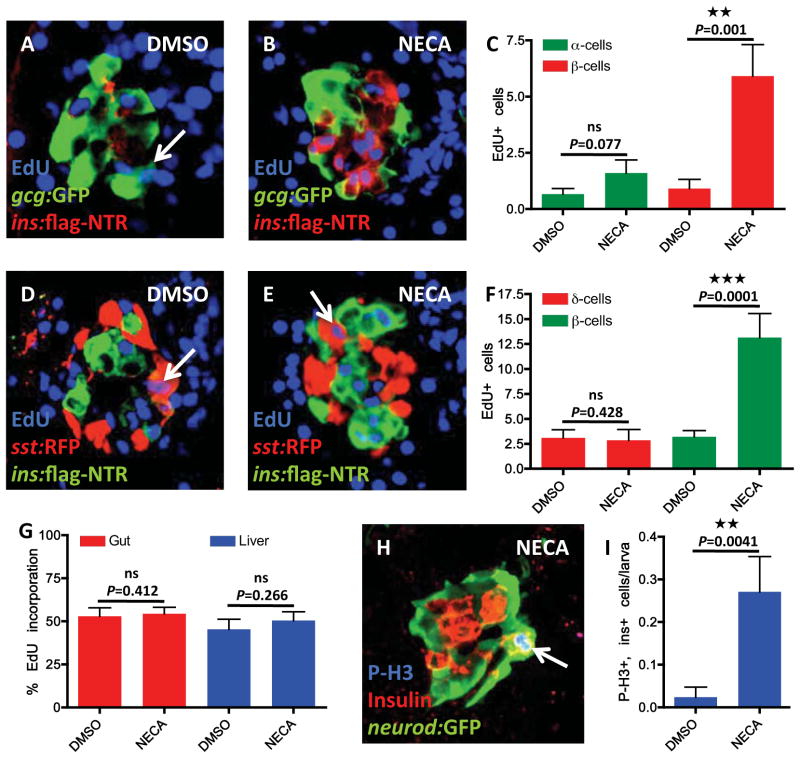
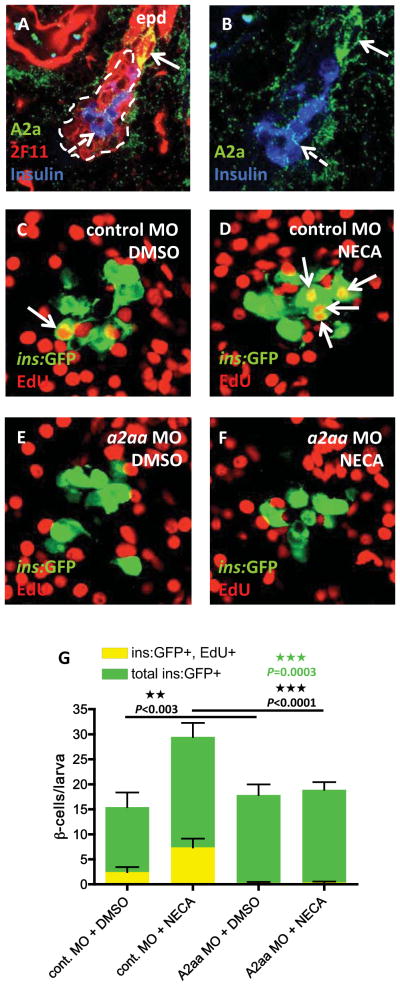
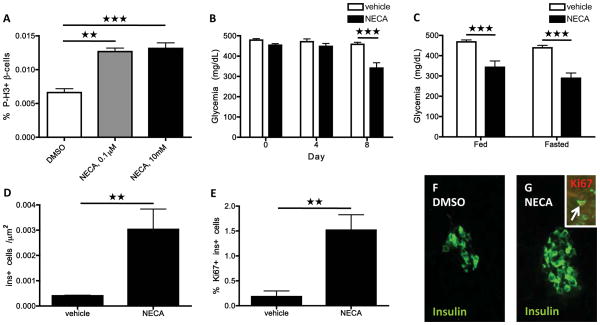
Diabetes can be controlled with insulin injections, but a curative approach that restores the number of insulin-producing β cells is still needed. Using a zebrafish model of diabetes, we screened ~7,000 small molecules to identify enhancers of β cell regeneration. The compounds we identified converge on the adenosine signaling pathway and include exogenous agonists and compounds that inhibit degradation of endogenously produced adenosine. The most potent enhancer of β cell regeneration was the adenosine agonist 5'-N-ethylcarboxamidoadenosine (NECA), which, acting through the adenosine receptor A2aa, increased β cell proliferation and accelerated restoration of normoglycemia in zebrafish. Despite markedly stimulating β cell proliferation during regeneration, NECA had only a modest effect during development. The proliferative and glucose-lowering effect of NECA was confirmed in diabetic mice, suggesting an evolutionarily conserved role for adenosine in β cell regeneration. With this whole-organism screen, we identified components of the adenosine pathway that could be therapeutically targeted for the treatment of diabetes.


Conflict of interest statement

The authors declare no conflict of interests.

Figures

Figure 1
Figure 1. A chemical screen for β-cell regeneration
(A) Schema for the β-cell regeneration screen. The pancreatic β-cells are conditionally targeted for ablation from 3–4 dpf by using β-cell specific expression of nitroreductase [Tg(ins:CFP-NTR)], which converts Metronidazole (MTZ) into a cytotoxic product. After washing away the MTZ, the larvae are placed in 96-well plates, and exposed to 2–50μM of the compounds in 1% DMSO. After 2 days of recovery, from 4–6 dpf, β-cell regeneration can be easily quantified in double-transgenic larvae, Tg(ins:CFP-NTR);Tg(ins:Kaede), because Kaede labels the β-cells with bright fluorescence. (B) Picture of a control Tg(ins:Kaede) larva at 6 dpf that was not affected by the MTZ treatment (because it does not express NTR) and therefore displays a typical number of β-cells, as visualized with the microscope used for screening. The inset displays a magnified view of the pancreatic islet (outlined by the dashed square). (C) 6 dpf Tg(ins:CFP-NTR);Tg(ins:Kaede) larva following β-cell ablation with MTZ from 3–4 dpf and vehicle treatment from 4–6 dpf. Typically, these control larvae have 3–7 β-cells at this stage. (D) Tg(ins:CFP-NTR);Tg(ins:Kaede) larva following β-cell ablation with MTZ from 3–4 dpf and treatment with the hit-compound NECA from 4–6 dpf. This particular larva contains too many β-cells to count without the use of confocal microscopy. (E) The hit-compounds converge on adenosine signaling/metabolism by targeting adenosine kinase (A-134974), adenosine receptors (NECA), and phosphodiesterase 3/4 (Cilostamide and Zardaverine). Compounds that increased β-cell regeneration more than two fold after two days of treatment are labeled in red. After re-screening all activators of adenosine signaling contained in the Sigma LOPAC library, we found that an adenosine deaminase inhibitor (EHNA) and another non-selective adenosine agonist (IB-MECA) (labeled in blue) could also increase β-cell regeneration, although less than two-fold. See also Figure S1.
Figure 2
Figure 2. The hit-compounds increase regeneration, not survival, of β-cells
(A) Schematic diagram for cell-labeling and assessment of β-cell survival/regeneration. To examine β-cell survival, we made use of the photo-convertible property of the fluorescent protein Kaede. At 3 dpf, before ablating the β-cells with MTZ from 3–4 dpf, we converted Tg(ins:Kaede)-expressing β-cells from green to red by exposing them to UV-light. After two days of regeneration (6 dpf), the surviving β-cells are red and green (yellow overlap), whereas the newly formed β-cells are green-only. (B & C) Confocal images of DMSO- and NECA-treated larvae with Tg(ins:Kaede)-expressing β-cells at 6 dpf. Note that there is one β-cell that survived the ablation in this particular DMSO-treated larva (arrow in B), whereas there are no β-cells that survived the ablation in this NECA-treated larva (C). (D) Quantification of β-cell regeneration (green bars) and β-cell survival (yellow bars) per larva at 6 dpf, following treatment with DMSO, NECA, Cilostamide, or A-134974 from 4–6 dpf. P < 0.0001; n = 10 larvae for each group. Error bars represent SEM. See also Figure S2.
Figure 3
Figure 3. NECA has a modest effect on normal β-cell development, but strongly accelerates β-cell regeneration
(A–D) Tg(ins:GFP);Tg(ins:CFP-NTR) larvae were treated with MTZ from 3–4 dpf to ablate the β-cells, and subsequently treated with DMSO/NECA and EdU during regeneration from 4–6 dpf. EdU was developed in red and nuclei were counterstained with topro (in blue). (A) Confocal image of a 6 dpf DMSO-treated larva displaying one β-cell that had incorporated EdU (arrow) during regeneration from 4–6 dpf. (B) Confocal image of a 6 dpf NECA-treated larva displaying 10 β-cells that had incorporated EdU (arrows) during regeneration from 4–6 dpf. (C) Quantification of the total number of β-cells (green bars) and β-cells that had incorporated EdU (white bars) per larva during DMSO or NECA treatment from 4–6 dpf during β-cell regeneration. (D) Rate of EdU incorporation, displayed as the percentage of β-cells that incorporated EdU. n = 18 larvae for each group. (E–H) Tg(ins:GFP) larvae were treated with DMSO/NECA and EdU from 4–6 dpf to assess EdU incorporation in β-cells during normal development. EdU was developed in red and nuclei were counterstained with topro (in blue). (E) Confocal image of a 6 dpf DMSO-treated larva showing no EdU incorporation in its β-cells between 4–6 dpf of normal development. (F) Confocal image of a 6 dpf NECA-treated larva displaying one β-cell that had incorporated EdU between 4–6 dpf of normal development. (G) Quantification of the total number of β-cells (green bars) and β-cells that had incorporated EdU (white bars) per larva during DMSO or NECA treatment from 4–6 dpf of normal development. (H) Rate of EdU incorporation, displayed as the percentage of β-cells that incorporated EdU. n = 25 larvae for DMSO-treated, and n = 32 larvae for NECA-treated. (I–J) During normal development of the dorsal pancreatic bud, Tg(ins:GFP) embryos were treated with DMSO or NECA from 6–18 hpf. Nuclei were counterstained with topro (blue). (I) Confocal projection of a DMSO-treated Tg(ins:GFP) embryo at 18 hpf. (J) Confocal projection of a NECA-treated Tg(ins:GFP) embryo at 18 hpf. We observed no significant difference in the number of β-cells. (K) Free-glucose levels during β-cell regeneration in the presence of DMSO or NECA. After being treated with MTZ from 3–4 dpf, the larvae either had an islet depleted of β-cells owing to the expression of Tg(ins:CFP-NTR) (NTR), or a normal islet because they were wild-type (WT). The larvae were subsequently treated with DMSO or NECA from 4–7 dpf. Free-glucose levels were significantly lower in NTR larvae treated with NECA (green line) than in NTR larvae treated with DMSO (yellow line), after treatment for 2 days (from 1164 to 820 pmol/larva, P = 0.0031) and 3 days (from 681 to 498 pmol/larva, P = 0.0292) days. n = 40 larvae (4 pools of 10 larvae) per data point. Error bars represent SEM. See also Figure S3.
Figure 4
Figure 4. NECA enhances proliferation of β-cells, and not cell proliferation in general
(A–C) Proliferation of α-cells was assessed by EdU incorporation in Tg(gcg:GFP)-expressing α-cells. Tg(gcg:GFP);Tg(ins:flag-NTR) larvae were treated with MTZ from 3–4 dpf for ablation of the β-cells, and subsequently treated with DMSO/NECA and EdU during β-cell regeneration from 4–6 dpf. (A) Confocal image of a DMSO-treated larva displaying one α-cell that had incorporated EdU (arrow). (B) Confocal image of a NECA-treated larva that does not show any EdU incorporation in α-cells, but substantial EdU incorporation in β-cells (positive for Tg(ins:flag-NTR) expression). (C) Quantification of EdU incorporation in α-cells (green bars) and β-cells (red bars) in the presence of DMSO or NECA. Note that the number of α-cells that incorporated EdU during treatment with NECA did not significantly increase, although incorporation of EdU in Tg(ins:flag-NTR)-expressing β-cells increased markedly in the same larvae. n = 11 larvae for each group. (D–F) Proliferation of δ-cells was assessed by EdU incorporation in Tg(sst:RFP)-expressing δ-cells. Tg(sst:RFP);Tg(ins:flag-NTR) larvae were treated with MTZ from 3–4 dpf for ablation of the β-cells, and subsequently treated with DMSO/NECA and EdU during β-cell regeneration from 4–6 dpf. (D) Confocal image of a DMSO-treated larva displaying one δ-cell that had incorporated EdU (arrow). (E) Confocal image of a NECA-treated larva displaying one δ-cell that had incorporated EdU, and substantial EdU incorporation in β-cells (positive for Tg(ins:flag-NTR) expression). (F) Quantification of EdU incorporation in δ-cells (red bars) and β-cells (green bars) in the presence of DMSO or NECA. n = 10 larvae for each group. (G) Quantification of proliferation in the gut and liver in Tg(ins:CFP-NTR) larvae following β-cell ablation from 3–4 dpf and subsequent treatment with DMSO/NECA from 4–6 dpf. The percentage of cells that incorporated EdU between 4–6 dpf during β-cell regeneration did not change with NECA treatment when compared to DMSO-treated controls. n = 10 larvae for each group. (H) The mitosis marker Phospho-Histone H3 (P-H3) co-labels a β-cell that expresses both insulin and Tg(neurod:GFP) (arrow) following β-cell ablation from 3–4 dpf and subsequent treatment with NECA from 4–6 dpf. Note that the β-cell that is positive for P-H3 is located in the periphery of the islet. (I) Quantification of β-cell proliferation, as marked by co-localization of insulin and P-H3, following β-cell ablation from 3–4 dpf and subsequent treatment with DMSO/NECA from 4–6 dpf. n = 42 larvae for DMSO-treated; n = 48 larvae for NECA-treated. Error bars represent SEM. See also Figures S4 & 5.
Figure 5
Figure 5. The adenosine receptor A2aa mediates the regenerative effect of NECA
(A) Confocal image of the expression of the A2a adenosine receptors in a 5 dpf larva. The 2F11 antibody marks the extra-pancreatic duct (epd) as well as the endocrine islet (outlined by the dashed line). High expression of A2a is found in cells budding off the epd (arrow), and low expression is found in insulin-expressing β-cells (dashed arrow) and cells scattered throughout the exocrine pancreas. (B) For clarity, a magnified view of (A), without the red color, is displayed. (C–G) Tg(ins:GFP);Tg(ins:CFP-NTR) embryos were injected with a control MO or an a2aa MO at the one-cell stage, and subsequently treated with MTZ from 3–4 dpf to ablate the β-cells, and DMSO/NECA and EdU during β-cell regeneration from 4–6 dpf. (C) Confocal image of a DMSO-treated control MO-injected larva displaying one β-cell that had incorporated EdU (arrow). (D) Confocal image of a NECA-treated control MO-injected larva displaying 4 β-cells that had incorporated EdU (arrows). (E) Confocal image of a DMSO-treated a2aa MO-injected larva where no β-cells had incorporated EdU. (F) Confocal image of a NECA-treated a2aa MO-injected larva where no β-cells had incorporated EdU. (G) Quantification of the total number of β-cells and the number of β-cells that incorporated EdU per larva during DMSO or NECA treatment of control MO-injected or a2aa MO-injected embryos. P-values in black refers to Tg(ins:GFP)+, EdU+ cells, whereas the P-value in green refers to total number of Tg(ins:GFP)+ cells. n = 11–25 larvae per group. Error bars represent SEM. See also Figure S6.
Figure 6
Figure 6. NECA enhances murine β-cell proliferation and glucose control after STZ-induced diabetes
(A) Proliferation rate of β-cells, displayed as percentage of P-H3-labeled β-cells, in isolated mouse islets following four days of vehicle or NECA treatment. P < 0.01 for 0.1 μM NECA; P < 0.001 for 10 μM NECA. (B) Blood glucose levels after STZ-induced diabetes and subsequent treatment with vehicle or NECA for 8 days. The blood glucose levels were determined in fed mice. P < 0.001; n = 21 mice for vehicle-treated; n = 18 mice for NECA-treated. (C) Blood glucose levels in fed and fasted state of STZ-injected mice after 15 days of treatment with vehicle or NECA. P < 0.001; n = 14 mice for vehicle-treated; n = 10 mice for NECA-treated. (D) β-cell mass as determined by the number of insulin-positive cells per unit area (Ins+ cell per μm2) in STZ-injected mice after 15 days of control or NECA treatment. P = 0.0058; n = 5 mice per group. (E) Proliferation of insulin-expressing cells in STZ-injected mice following vehicle or NECA treatment. Quantification of the percent of insulin-positive cells that co-labeled with Ki67. P = 0.0019; n = 5 mice per group. (F–G) Representative images of islets in STZ-injected mice after 15 days of vehicle (F) or NECA treatment (G). A Ki67+ Ins+ cell (arrow) in a NECA-treated mouse is shown in the inset (G). Error bars represent SEM.

Comment in

References

    1. Ackermann AM, Gannon M. Molecular regulation of pancreatic beta-cell mass development, maintenance, and expansion. J Mol Endocrinol. 2007;38:193–206. - PubMed
    1. Ando R, Hama H, Yamamoto-Hino M, Mizuno H, Miyawaki A. An optical marker based on the UV-induced green-to-red photoconversion of a fluorescent protein. Proc Natl Acad Sci U S A. 2002;99:12651–12656. - PMC - PubMed
    1. Annes JP, Ryu JH, Lam K, Carolan PJ, Utz K, Hollister-Lock J, Arvanites AC, Rubin LL, Weir G, Melton DA. Adenosine kinase inhibition selectively promotes rodent and porcine islet beta-cell replication. Proceedings of the National Academy of Sciences of the United States of America. 2012;109:3915–3920. - PMC - PubMed
    1. Bonner-Weir S, Li WC, Ouziel-Yahalom L, Guo L, Weir GC, Sharma A. Beta-cell growth and regeneration: replication is only part of the story. Diabetes. 2010;59:2340–2348. - PMC - PubMed
    1. Chhabra P, Wang K, Zeng Q, Jecmenica M, Langman L, Linden J, Ketchum RJ, Brayman KL. Adenosine A(2A) agonist administration improves islet transplant outcome: Evidence for the role of innate immunity in islet graft rejection. Cell Transplant. 2010;19:597–612. - PubMed

Publication types

MeSH terms