. 2012 May 25;36(5):769-81.
doi: 10.1016/j.immuni.2012.02.019. Epub 2012 May 17.

Disruption of Fnip1 reveals a metabolic checkpoint controlling B lymphocyte development

Affiliations

Disruption of Fnip1 reveals a metabolic checkpoint controlling B lymphocyte development

Heon Park et al. Immunity. .

Abstract

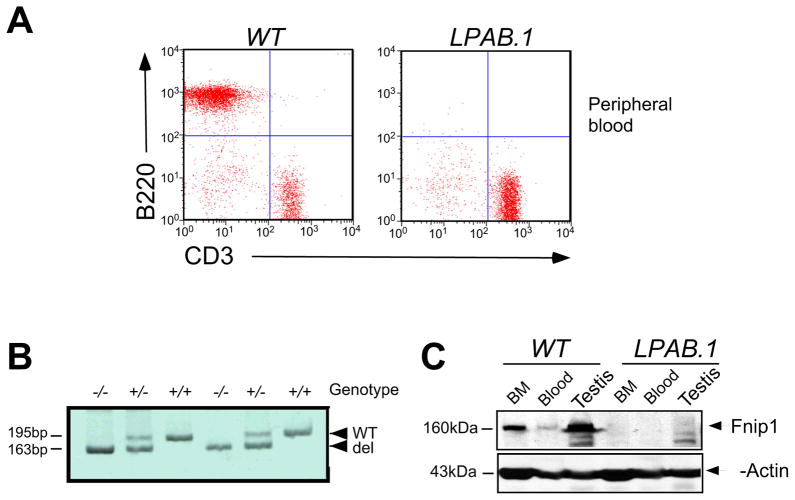
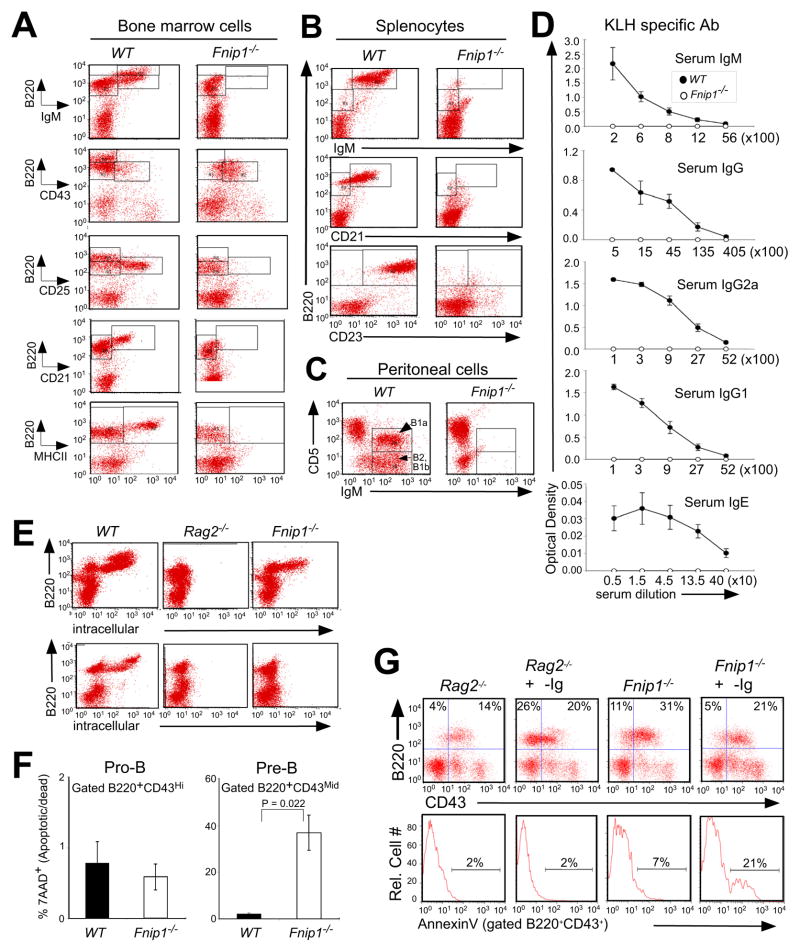
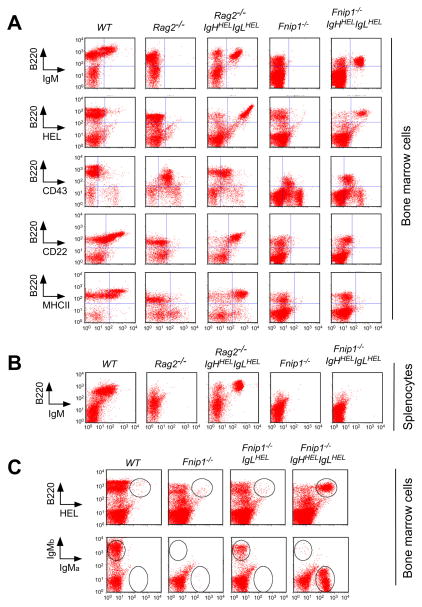
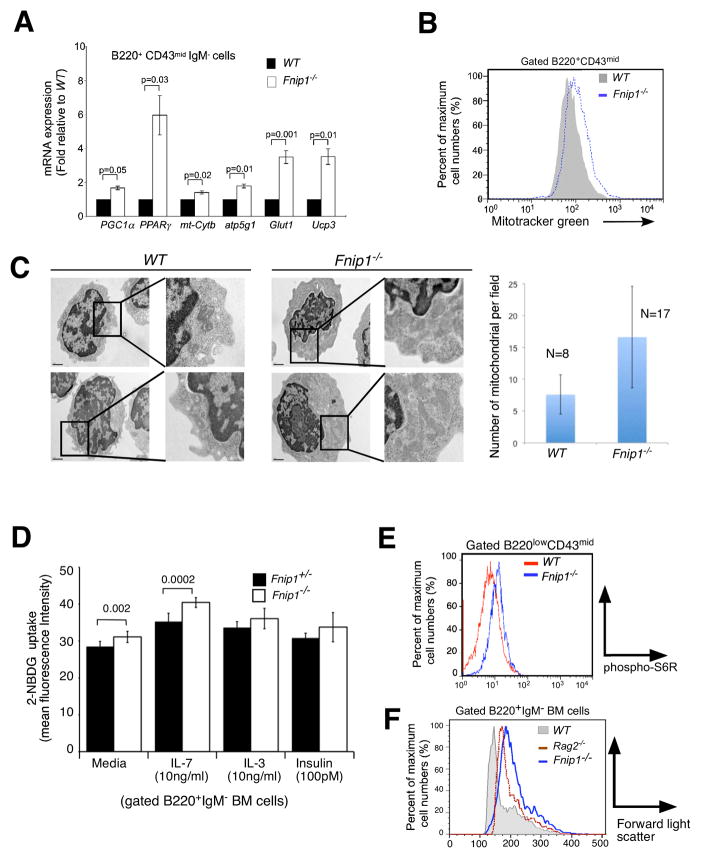
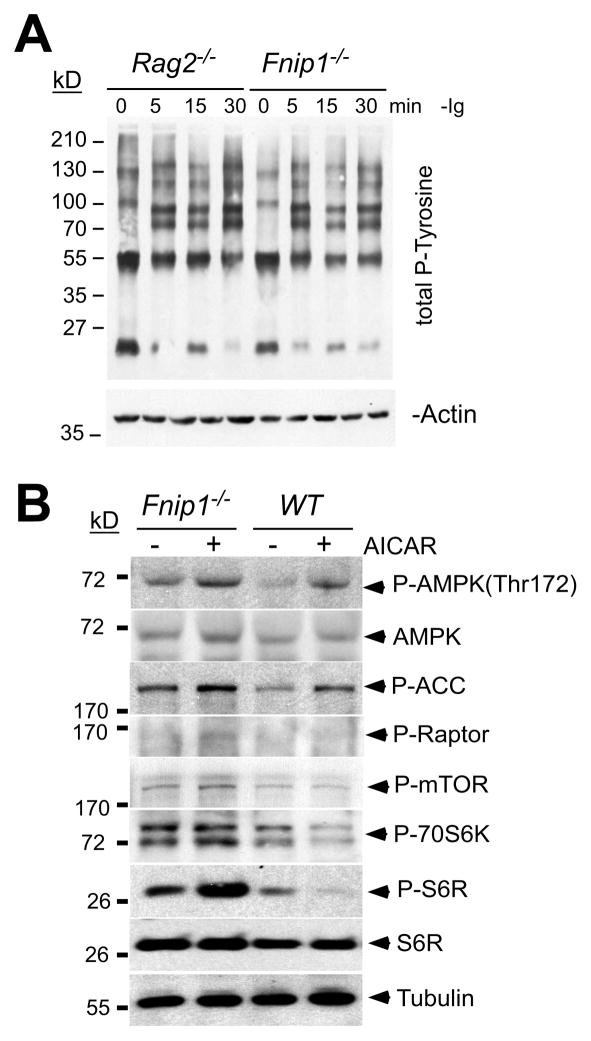
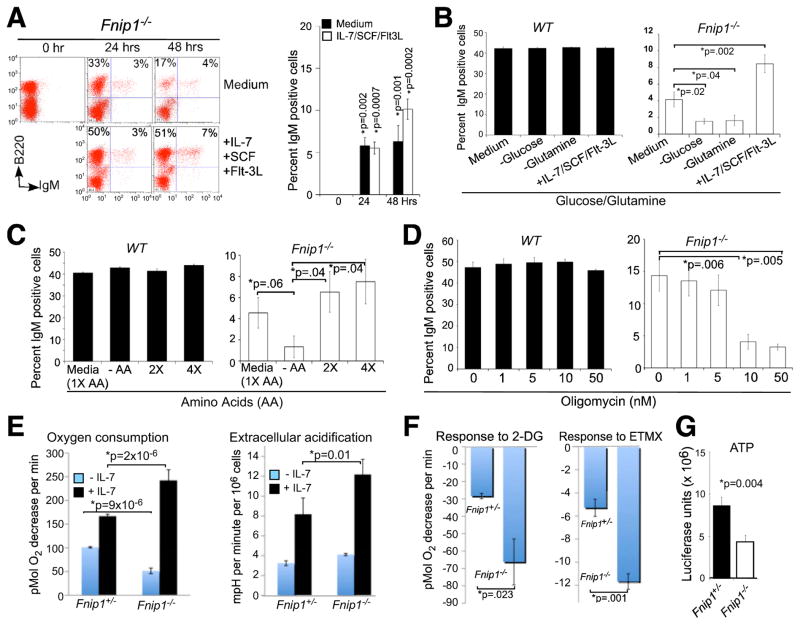
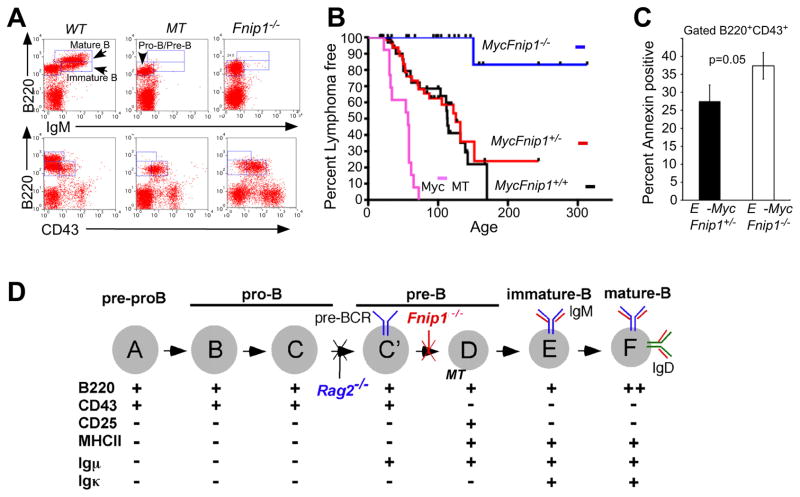
The coordination of nutrient and energy availability with cell growth and division is essential for proper immune cell development and function. By using a chemical mutagenesis strategy in mice, we identified a pedigree that has a complete block in B cell development at the pre-B cell stage resulting from a deletion in the Fnip1 gene. Enforced expression of an immunoglobulin transgene failed to rescue B cell development. Whereas essential pre-B cell signaling molecules were activated normally in Fnip1-null pre-B cells, the metabolic regulators AMPK and mTOR were dysregulated, resulting in excessive cell growth and enhanced sensitivity to apoptosis in response to metabolic stress (pre-B cell receptor crosslinking, oncogene activation). These results indicate that Folliculin-interacting protein 1 (Fnip1) is vital for B cell development and metabolic homeostasis and reveal a metabolic checkpoint that may ensure that pre-B cells have sufficient metabolic capacity to support division, while limiting lymphomagenesis caused by deregulated growth.


Conflict of interest statement

The authors have no competing financial interests.

Figures

Figure 1
Figure 1. LPAB.1 mice lack peripheral B cells and have a deletion in the Fnip1 gene
(A) Flow cytometric analyses of peripheral blood samples from LPAB.1 and WT mice revealed the absence of B220+ B cells, while CD3ε+ T cells were represented normally. (B) A PCR genotyping strategy was designed using oligonucleotides spanning the 32-bp deleted region in the Fnip1 gene. Shown is an ethidium-stained acrylamide gel containing PCR products amplified from WT, Fnip1+/−, and Fnip1−/− genomic DNA. (C) Representative immunoblot showing the absence of Fnip1 protein in testis, bone marrow cells (BM), and blood from Fnip1−/− mice relative to WT littermates.
Figure 2
Figure 2. Loss of Fnip1 results in a complete block in B cell development at the pre-B cell stage
BM cells (A), splenocytes (B), and peritoneal cells (C) derived from Fnip1−/− and WT mice were stained with fluorescent-conjugated antibodies and analyzed by flow cytometry. Shown are representative histograms (of 8 mice/group). B1a, B1b, and B2 refer to types of B cells (Hardy and Hayakawa, 2001). (D) Fnip1−/− and WT mice (5 mice/group) were immunized with KLH, and sera were tested for KLH-specific antibodies by ELISA. (E) BM cells from Fnip1−/−, Rag2−/− and WT mice were intracellularly stained with fluorescent-conjugated α-Igμ (upper) and α-Igκ (lower) after α-B220 surface staining. Shown are representative flow cytometric histograms obtained from five mice/group. (F) Decreased cell viability of B220lowCD43mid BM cells from Fnip1−/− mice. BM cells were stained with α-B220, α-CD43 and 7AAD. Cell viability was determined by flow cytometry. Bar graphs depict percent apoptotic/dead (7AAD+) cells (mean ± SEM) on gated B220+CD43hi cells, or B220+CD43mid cells. p-value is shown from 3 mice/group. (G) Rag2−/− and Fnip1−/− mice were injected intraperitoneally with 250μg of α-Igβ MAb HM79. On day 7 post-injection, bone marrow cells were stained with antibodies specific to B220, CD43, and Annexin V. Anti-Igβ stimulates the development of Rag2−/− pro-B cells but induces apoptosis of Fnip1−/− pro-B cells. (See also Figure S2)
Figure 3
Figure 3. Enforced expression of Ig heavy and Ig light chains fail to drive B cell development in Fnip1-null mice, whereas allelic exclusion occurs normally
Total BM cells (A) and splenocytes (B) from WT, Rag2−/−, Rag2−/−IgHHELIgLHEL, Fnip1−/−, Fnip1−/−IgHHELIgLHEL mice were analyzed by flow cytometry utilizing the indicated fluorescent-conjugated antibodies. IgMHEL stimulates the development of Rag2−/− pro-B cells but fails to stimulate the maturation of Fnip1−/− pre-B cells. Representative histograms of 5 mice/group are shown ((A)(B)). (C) Allelic exclusion occurs normally in Fnip1−/− mice. Total BM cells from the indicated mice were stained with fluorescent-conjugated α-B220 and α-HEL (top), or α-IgMa and α-IgMb (bottom). Shown are representative flow cytometric histograms from 4 mice/group.
Figure 4
Figure 4. Loss of Fnip1 results in metabolic dysregulation in pre-B cells defined by increased expression of AMPK and mTOR regulated genes, increased mitochondrial biogenesis, and increased mTOR-mediated cell growth
(A) Purified pre-B cell cDNA from Fnip1−/− and WT mice were subjected to real-time PCR specific for the indicated genes. Bars = means ± SEM of 3 mice/group. P-values are shown. (B) Increased mitochondria in Fnip1−/− pre-B cells. Fnip1−/− and WT BM cells were stained with α-B220, α-CD43 plus the mitochondrial dye MitoTracker® green. Shown is a representative flow cytometric histogram (n=3 mice/group) of gated B220+CD43+ cells. (C) Transmission electron micrographs were obtained on FACS-sorted pre-B cells from 3 WT and 3 Fnip1−/− mice. (left) Shown are representative high-power images (20,000X). (Right) The number of mitochondria per field were enumerated in the cytoplasmic compartment for 8 WT and 17 Fnip1−/− pre-B cells. Bars = means ± SEM. p<0.00006. (D) Increased glucose uptake in Fnip1−/− pre-B cells. Total BM cells were cultured in media, IL-7, IL-3, or insulin at the indicated concentrations for 48 hrs. 2-NDBG was added for the last 3 hrs. Shown is bar graph (n=3 per group for IL-7, n=2 per group in triplicate for IL-3, insulin) showing the relative fluorescence intensity of B220+IgM gated cells as assessed by flow cytometry. Error bars= mean+/−SEM. P-values are shown. (F) Fnip1−/− and WT BM cells were stained with α-B220, α-CD43, and intracellular pS6R. (G) Shown is a representative forward-light scatter (FSC) histogram overlay comparing the size of gated B220+IgM pro-B and pre-B cells from WT, Rag2−/−, and Fnip1−/− mice. (see also Figure S4)
Figure 5
Figure 5. Dysregulated mTOR signaling in Fnip1−/− pre-B cells
(A) B cell progenitors from Rag2−/− and Fnip1−/− mice were activated with α-Igβ at the indicated time points. Immunoblots were probed with antibodies against total phosphotyrosine. (B) Fnip1−/− and WT mice were injected with the AMPK-activator AICAR. Total BM cells from untreated or AICAR treated mice were isolated 18 hrs post-injection and B220+CD43+ cells were FACs-sorted. Immunoblots (representative of 3–4 experiments) were performed using the indicated antibodies. α-Tubulin was utilized as a loading control. (see also Figure S5)
Figure 6
Figure 6. Loss of Fnip1 alters metabolic homeostasis and sensitizes pre-B cells to nutrient and IL-7 restriction
(A) In vitro nutrient supplementation partially rescues IgM expression in Fnip1−/− B cell progenitors. Total BM derived from WT and Fnip1−/− mice were grown in complete B cell growth media for 0, 24, or 48 hrs in the presence or absence of growth factors (IL-7, SCF and Flt-3L). Cells were analyzed by a flow cytometry using fluorescent conjugated α-B220 and α-IgM. Bars represent the means ± SEM from 6 mice per group. (B) Depletion of glucose or glutamine inhibits the development of Fnip1−/− pre-B cells in vitro. FACS-sorted B220low IgM cells were grown in complete media in the presence or absence of growth factors, glucose, or glutamine for 48 hrs. Cells were analyzed by a flow cytometry using fluorescent conjugated α-B220 and α-IgM. Bars represent the means ± SEM from WT (n=3) and Fnip1−/− (n=6) mice. (C–D) Total BM were cultured in complete media for 48 hrs in the presence of (C) different amounts of essential amino acids (no AA, or 1X, 2X, or 4X AA), or (D) oligomycin (0, 1, 5, 10, 50 nM). Cells were analyzed by a flow cytometry using fluorescent conjugated α-B220 and α-IgM. Bars represent the means ± SEM from WT (n=4) and Fnip1−/− mice (n=4) on gated B220low populations. (E, F) Oxygen consumption rate (OCR) and Extracellular acidification (ECAR) were measured using a Seahorse Bioscience® extracellular flux analyzer over the course of 150 minutes. FACs-sorted pro/pre-B cells from Fnip1+/− and Fnip1−/− BM were cultured in the absence or presence of growth factors (10 ng/ml of IL-7 and SCF) for 24 hrs prior to analyses. (E) OCR and ECAR were then measured within 5 minutes of culture. Shown is the mean ± SEM from 5 mice per group. P-values are shown. (F) OCR were measured within 5 minutes of culture in the presence of 2-deoxyglucose (2-DG) or etomoxir (ETMX). Shown is the decrease in OCR following treatment relative to pre-treatment baseline. Mean ± SEM (3 mice per group). (G) ATP levels from FACs-sorted WT (n=3) and Fnip1−/− (n=3) pre-B cells were determined using a luciferase assay. Mean ± SEM (3 mice per group). P-values are shown.
Figure 7
Figure 7. Loss of Fnip1 inhibits pre-B cell lymphomagenesis induced by the Eμ-c-Myc transgene
(A) Disruption of the transmembrane portion of Igμ (μMT) or Fnip1 (Fnip1−/−) in mice blocks B cell development at the pre-B cell stage. BM cells from B cell deficient Fnip1−/− or μMT (control) mice were stained with fluorescent-conjugated antibodies and analyzed by flow cytometry. (B) Fnip1−/− or μMT mice were bred to Eμ-Myc transgenic mice. Mice were euthanized when lymphomas were detected. Kaplan-Meier lymphoma-free estimates are shown for MycFnip1+/+ (n=33), MycFnip1+/− (n=66), MycFnip1−/− (n=24), and MycμMT (n=13). Lymphoma-free curves are significantly different between MycFnip1+/− and MycFnip1−/− (p<0.0001), MycFnip1+/+ and MycFnip1−/− (p<0.0004), MycμMT and MycFnip1−/− (<0.0001), and MycμMT and MycFnip1+/− (<0.0001) using Log Rank Mantel-Cox Test. (C) Disruption of Fnip1 results in increased apoptosis of Myc-expressing pre-B cells. MycFnip1−/− and MycFnip1+/− BM were stained with α-B220, α-CD43, and Annexin V. Shown is a bar graph (mean ± SEM, 3 mice per group) depicting the percent Annexin V positive cells within a B220+CD43+ gate. (D) A model of B cell development (modified from (Hardy and Hayakawa, 2001), characterized by the differential expression of surface and intracellular molecules. Shown are the stages whereby loss of Fnip1, Rag2, or Igμ (μMT) result in arrested B cell development.

Similar articles

Cited by

References

    1. Adams JM, Harris AW, Pinkert CA, Corcoran LM, Alexander WS, Cory S, Palmiter RD, Brinster RL. The c-myc oncogene driven by immunoglobulin enhancers induces lymphoid malignancy in transgenic mice. Nature. 1985;318:533–538. - PubMed
    1. Allen CD, Okada T, Tang HL, Cyster JG. Imaging of germinal center selection events during affinity maturation. Science. 2007;315:528–531. - PubMed
    1. Appleby MW, Ramsdell F. A forward-genetic approach for analysis of the immune system. Nat Rev Immunol. 2003;3:463–471. - PubMed
    1. Arad M, Seidman CE, Seidman JG. AMP-activated protein kinase in the heart: role during health and disease. Circ Res. 2007;100:474–488. - PubMed
    1. Baba M, Hong SB, Sharma N, Warren MB, Nickerson ML, Iwamatsu A, Esposito D, Gillette WK, Hopkins RF, 3rd, Hartley JL, et al. Folliculin encoded by the BHD gene interacts with a binding protein, FNIP1, and AMPK, and is involved in AMPK and mTOR signaling. Proc Natl Acad Sci U S A. 2006;103:15552–15557. - PMC - PubMed

MeSH terms

Associated data