. 2012 Aug;26(6):959-71.
doi: 10.1016/j.bbi.2012.05.005. Epub 2012 May 17.

Altered synaptic transmission in the hippocampus of transgenic mice with enhanced central nervous systems expression of interleukin-6

Affiliations

Altered synaptic transmission in the hippocampus of transgenic mice with enhanced central nervous systems expression of interleukin-6

T E Nelson et al. Brain Behav Immun. 2012 Aug.

Abstract

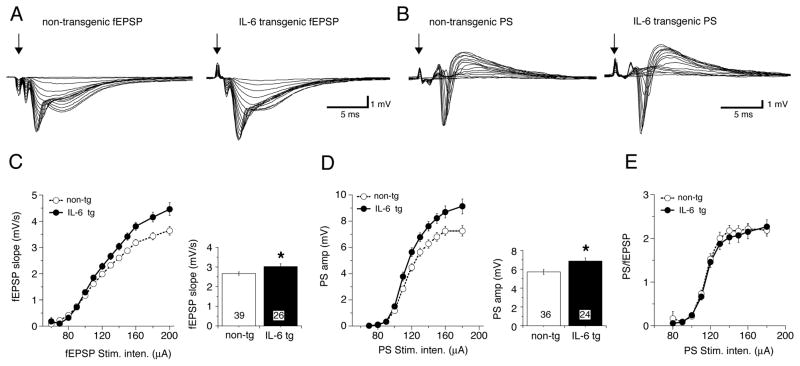
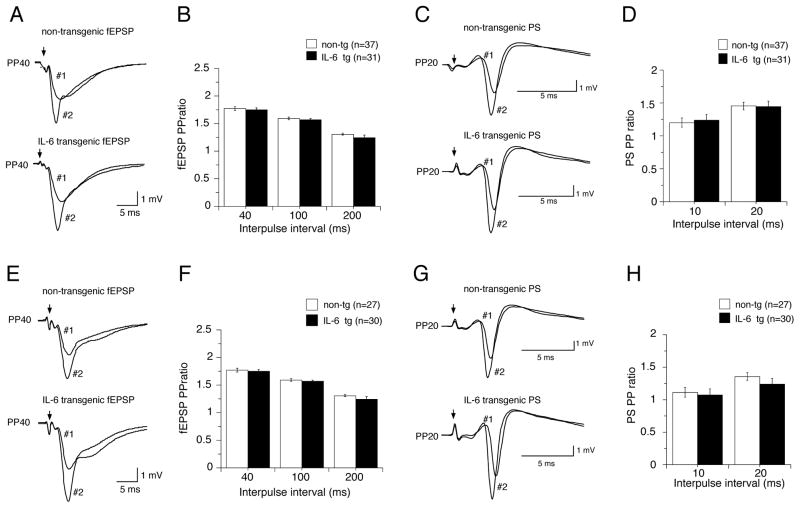
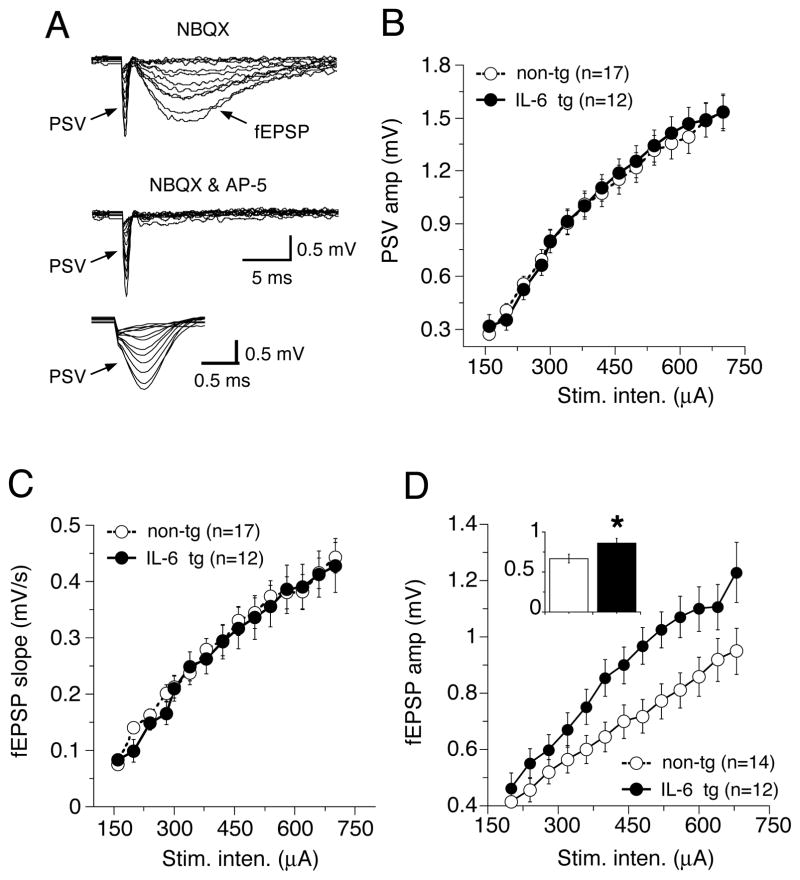
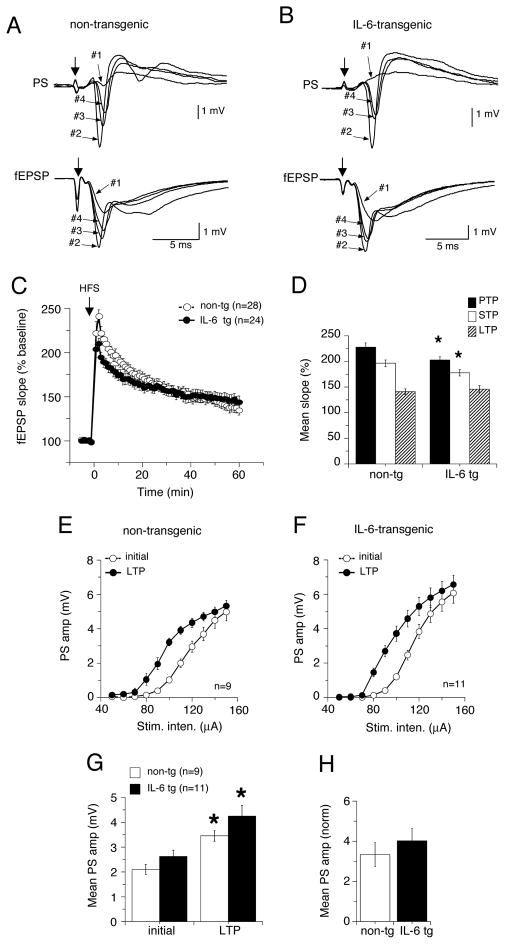
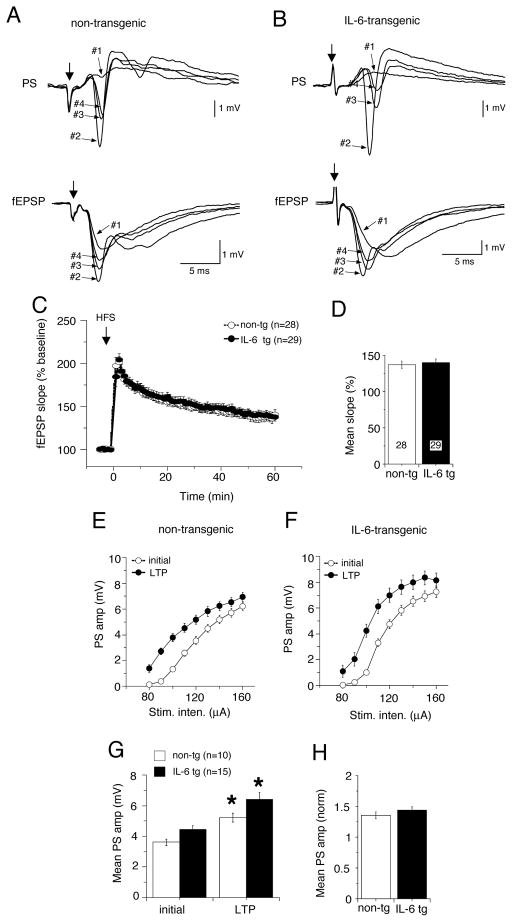
Elevated levels of the inflammatory cytokine interleukin-6 (IL-6) occur in a number of CNS disorders. However, little is known about how this condition affects CNS neuronal function. Transgenic mice that express elevated levels of IL-6 in the CNS show cognitive changes, increased propensity for hippocampal seizures and reduced number of inhibitory interneurons, suggesting that elevated levels of IL-6 can cause neuroadaptive changes that alter hippocampal function. To identify these neuroadaptive changes, we measured the levels of protein expression using Western blot analysis and synaptic function using field potential recordings in hippocampus from IL-6 transgenic mice (IL-6 tg) and their non-transgenic (non-tg) littermates. Western blot analysis showed enhanced levels of the GFAP and STAT3 in the IL-6 tg hippocampus compared with the non-tg hippocampus, but no difference for several other proteins. Field potential recordings of synaptic transmission at the Schaffer collateral to CA1 synapse showed enhanced dendritic excitatory postsynaptic potentials and somatic population spikes in the CA1 region of hippocampal slices from IL-6 tg mice compared with slices from non-tg littermate controls. No differences were observed for several forms of short-term and long-term synaptic plasticity between hippocampal slices from IL-6 tg and non-tg mice. These results demonstrate that elevated levels of IL-6 can alter mechanisms involved in the excitability of hippocampal neurons and synapses, an effect consistent with recent evidence indicating that elevated production of IL-6 plays an important role in conditions associated with seizure activity and in other impairments observed in CNS disorders with a neuroinflammatory component.


Figures

Figure 1
Figure 1
Western blot analysis of protein levels in IL-6 tg and non-tg hippocampus. A variety of cellular (A), signal transduction (B) and synaptic (C) proteins were examined. Results are expressed as mean normalized values (see Methods). Representative Western blots are shown above the graphs for the protein level. In B, inset at right shows representative immunoblots for pSTAT3 (n=4 for IL-6 tg and non-tg each). Numbers in bars indicate the number of mice tested. * = significantly different from non-tg (unpaired t-test, p< 0.05)
Figure 2
Figure 2
Altered postsynaptic responses in hippocampal slices from young IL-6 tg mice (1–2 months of age). A–B. Representative field potential recordings in the dendritic (fEPSP; A) and somatic (PS; B) region of area CA1 of slices taken from IL-6 tg and non-tg mice. Each set of traces represents field responses to Schaffer collateral stimulation over a range of stimulus intensities. Input-output (I-O) relationships were plotted from the data (C,D). C,D. Slices from IL-6 tg mice exhibited a significantly larger fEPSP (C) and PS (D) at the higher stimulus intensities compared to the slices from non-tg mice. Graph of mean values for higher stimulus intensities (<120 μA) is shown to the right. Numbers in boxes show number of slices tested. * = significantly different from non-tg (unpaired t-test, p< 0.05). E. PS/EPSP relationship. When the PS amplitude was expressed as a function of fEPSP slope, there was no significant difference in the ratio between non-tg and IL-6 tg hippocampus. This result indicates that the increased size of the fEPSP is responsible for the larger PS observed in the IL-6 tg hippocampus. In this and other figures some error bars are smaller than the symbol that indicates the mean value.
Figure 3
Figure 3
Altered postsynaptic responses in hippocampal slices from adult IL-6 tg mice. A–B. Representative field potential recordings (I-O curves) in the dendritic (fEPSP; A) and somatic (PS; B) region of area CA1 of slices taken from IL-6 tg and non-tg mice. Each set of traces represents field responses to Schaffer collateral stimulation over a range of stimulus intensities. Input-output (I-O) relationships were plotted from the data (C,D). C,D. Slices from IL-6 tg mice exhibited a significant larger fEPSP (C) and PS (D) at the higher stimulus intensities compared to the slices from non-tg mice. Graph showing mean values for higher stimulus intensities (<100 μA) is shown to the right. Numbers in boxes show number of slices tested. * = significantly different from non-tg (unpaired t-test, p< 0.05). E. PS/EPSP relationship. When the PS amplitude was expressed as a function of fEPSP slope, there was no significant difference in the ratio between non-tg and IL-6-transgenic hippocampus. These results indicate that the increased size of the fEPSP is responsible for the larger PS observed in the IL-6 tg hippocampus.
Figure 4
Figure 4
Paired-pulse studies in hippocampal slices from young and adult IL-6 tg and non-tg mice. A,C,E.G. Sample field recordings of CA1 pyramidal neurons showing conditioning (#1) and test (#2) responses to pairs of stimuli delivered to Schaffer collateral afferents. Paired-pulse protocols with either long (40–200 ms) or short (10–20 ms) interpulse intervals were used to examine PPF of dendritic fEPSPs (A,E) and inhibitory influences in the somatic region that influence the PS (C, G), respectively. B,D. PPF (fEPSP PP ratio) and PPRPS (PS PP ratio) were expressed as the ratio of the fEPSP slopes or PS amplitudes, respectively, of the second response (#2) with respect to the first response (#1). PPF and PPRPS were unaltered in slices from young or adult IL-6 tg mice compared with their age-matched non-tg littermate controls.
Figure 5
Figure 5
Synaptic transmission in the presence of NBQX. A. Sample field recordings from CA1 pyramidal neurons in the presence of NBQX to block the AMPA receptor mediated component of the synaptic response. The PSV and NMDA receptor-mediated fEPSP are evident. The PSV is shown at a faster timebase in the bottom panel. The NMDA receptor blocker AP-5 completely blocked the NMDA receptor-mediated fEPSP. B–D. Input-output curves for the PSV amplitude (B), fEPSP slope (C) and peak amplitude of the fEPSP in the IL-6-tg and non-tg hippocampal slices. The inset in D shows graph of mean values for all stimulus intensities. * = significantly different from non-tg (unpaired t-test, p< 0.05)
Figure 6
Figure 6
Long-term potentiation (LTP) in hippocampal slices from young IL-6 tg and non-tg mice. LTP was induced by high frequency stimulation (HFS) of Schaffer collaterals and synaptic responses were monitored for 60 min after HSF. A,B. Representative traces showing dendritic (fEPSP) and somatic (PS) field recordings of CA1 pyramidal neurons from non-tg (A) IL-6 tg (B) slices 5 min before (#1, baseline) HFS and after HFS during PTP (#2), STP (#3) and LTP (#4). C. Graph showing mean values for fEPSP slope expressed as a percent of baseline values measured a 1 min intervals in non-tg and IL-6 tg hippocampus. D. Graph showing mean values for fEPSP slope as a percent of baseline values during PTP, STP and LTP (1–3, 5–13 and 51–60 min post HFS, respectively). * = significantly different from non-tg values for the same measurement (unpaired t-test, p< 0.05). LTP of fEPSPs was unaltered in IL-6 tg slices relative to non-tg slices, but PTP and STP were reduced. E,F. I-O curves for the PS taken before and >60 min after LTP induction in non-tg and IL-6 tg hippocampus showed a leftward shift for both non-tg (E) and IL-6 tg (F) hippocampus, indicating LTP of the PS. G. Mean values for PS amplitude for stimulations of 80 to 140 μA. * = significantly different from initial values for the same measurement (unpaired t-test, p< 0.05). H. Graph showing relative increase in PS amplitude in slice from non-tg and IL-6 tg hippocampus determined by normalizing the amplitude of the PS >60 min after LTP induction to the value before LTP induction. No significant difference was observed between mean values for the PS indicating that the degree of LTP of the PS was similar for non-tg and IL-6 tg hippocampus.
Figure 7
Figure 7
Long-term potentiation in hippocampal slices from adult IL-6 tg and non-tg mice. LTP was induced by high frequency stimulation (HFS) of Schaffer collaterals and synaptic responses were monitored for 60 min after HSF. A,B. Representative traces showing dendritic (fEPSP) and somatic (PS) field recordings of CA1 pyramidal neurons from non-tg (A) IL-6 tg (B) slices 5 min before (#1, baseline) HFS and after HFS during PTP (#2), STP (#3) and LTP (#4). C. Graph showing mean values for fEPSP slope expressed as a percent of baseline values measured a 1 min intervals in non-tg and IL-6 tg hippocampus. D. Graph showing mean values for fEPSP slope as a percent of baseline values during LTP (51–60 min post HFS). LTP of fEPSPs was of similar magnitude in IL-6 tg and non-g slices. E,F. I-O curves for the PS taken before and 60 min after LTP induction in non-tg and IL-6 tg hippocampus showed a leftward shift for both non-tg (E) and IL-6 tg (F) hippocampus, indicating LTP of the PS. G. Mean values for PS amplitude for stimulations of 90 to 160 μA. * = significantly different from initial values for the same measurement (unpaired t-test, p< 0.05). H. Graph showing relative increase in PS amplitude in slice from non-tg and IL-6 tg hippocampus determined by normalizing the amplitude of the PS >60 min after LTP induction to the value before LTP induction. No significant difference was observed between mean values for the PS indicating that the degree of LTP of the PS was similar for non-tg and IL-6 tg hippocampus.

References

    1. Akira S, Hirano T, Taga T, Kishimoto T. Biology of multifunctional cytokines: IL-6 and related molecules (IL-1 and TNF) FASEB Journal. 1990;4:2860–2867. - PubMed
    1. Andreasen M, Hablitz JJ. Paired-pulse facilitation in the dentate gyrus: a patch-clamp study in rat hippocampus in vitro. J Neurophysiol. 1994;72:326–336. - PubMed
    1. Andressen C, Blumcke I, Celio MR. Calcium-binding proteins: selective markers of nerve cells. Cell Tissue Res. 1993;271:181–208. - PubMed
    1. Bajova H, Nelson TE, Gruol DL. Chronic CXCL10 alters the level of activated ERK1/2 and transcriptional factors CREB and NF-kB in hippocampal neuronal cell culture. J Neuroimmunology. 2008;195:36–46. - PMC - PubMed
    1. Balschun D, Wetzel W, Del Rey A, Pitossi F, Schneider H, Zuschratter W, Besedovsky HO. Interleukin-6: a cytokine to forget. FASEB Journal. 2004;18:1788–1790. - PubMed

Publication types

MeSH terms