

How mechanisms of perceptual decision-making affect the psychometric function
- PMID: 22609483
- PMCID: PMC3445702
- DOI: 10.1016/j.pneurobio.2012.05.008
How mechanisms of perceptual decision-making affect the psychometric function
Abstract
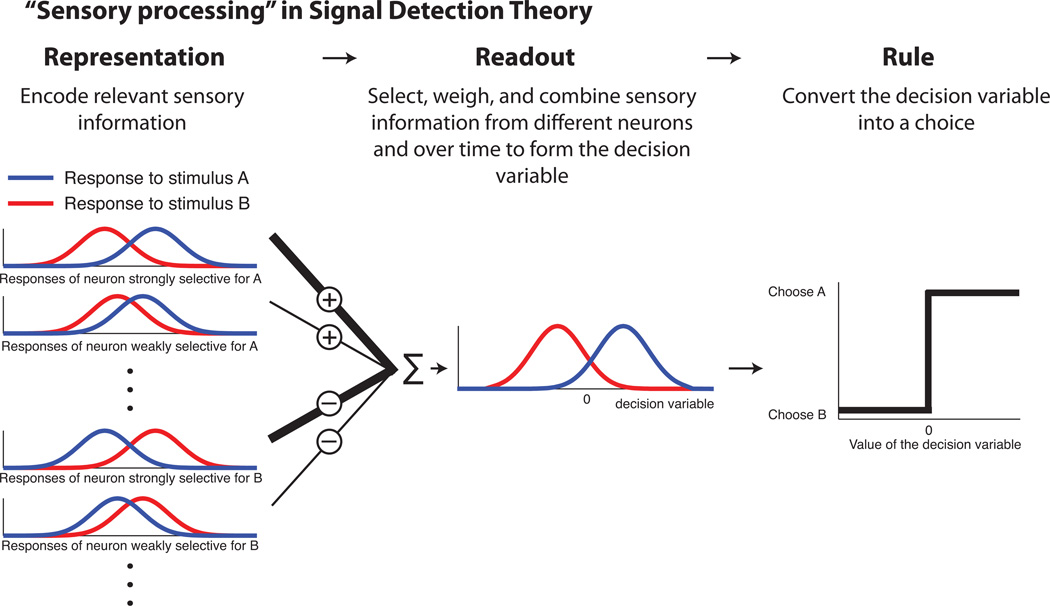
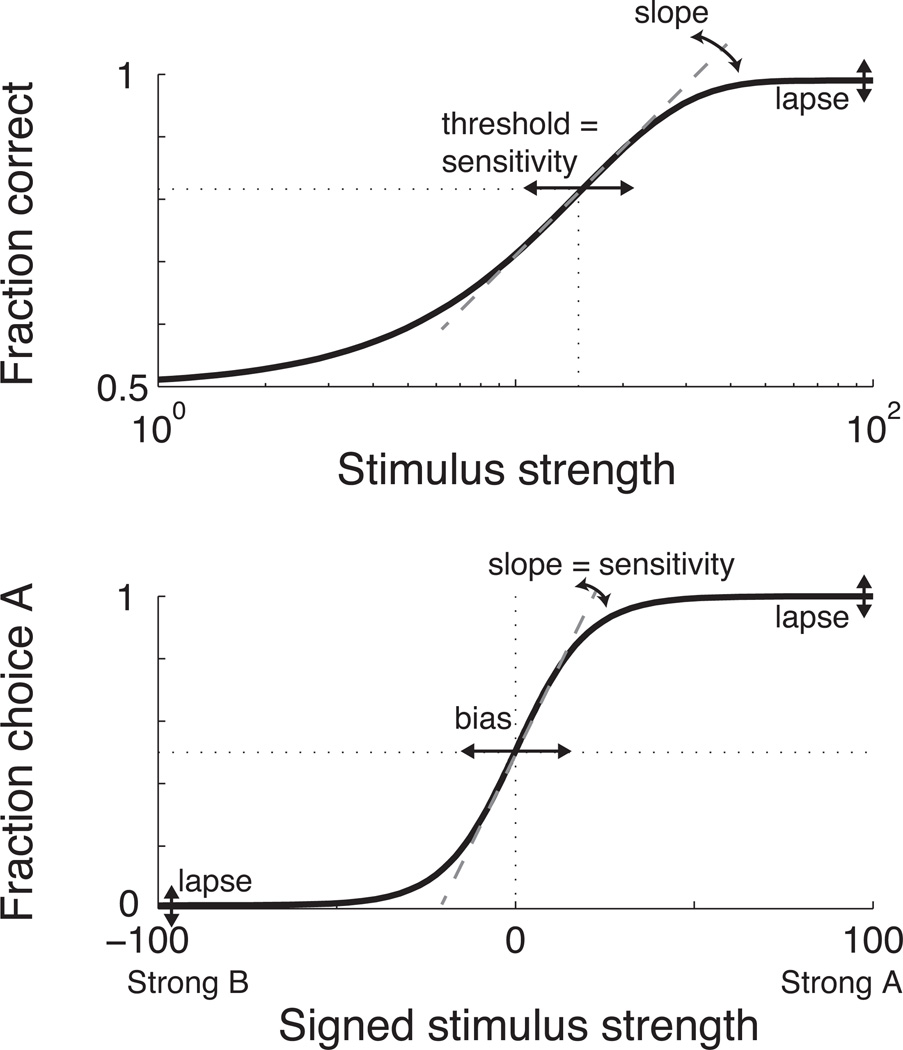
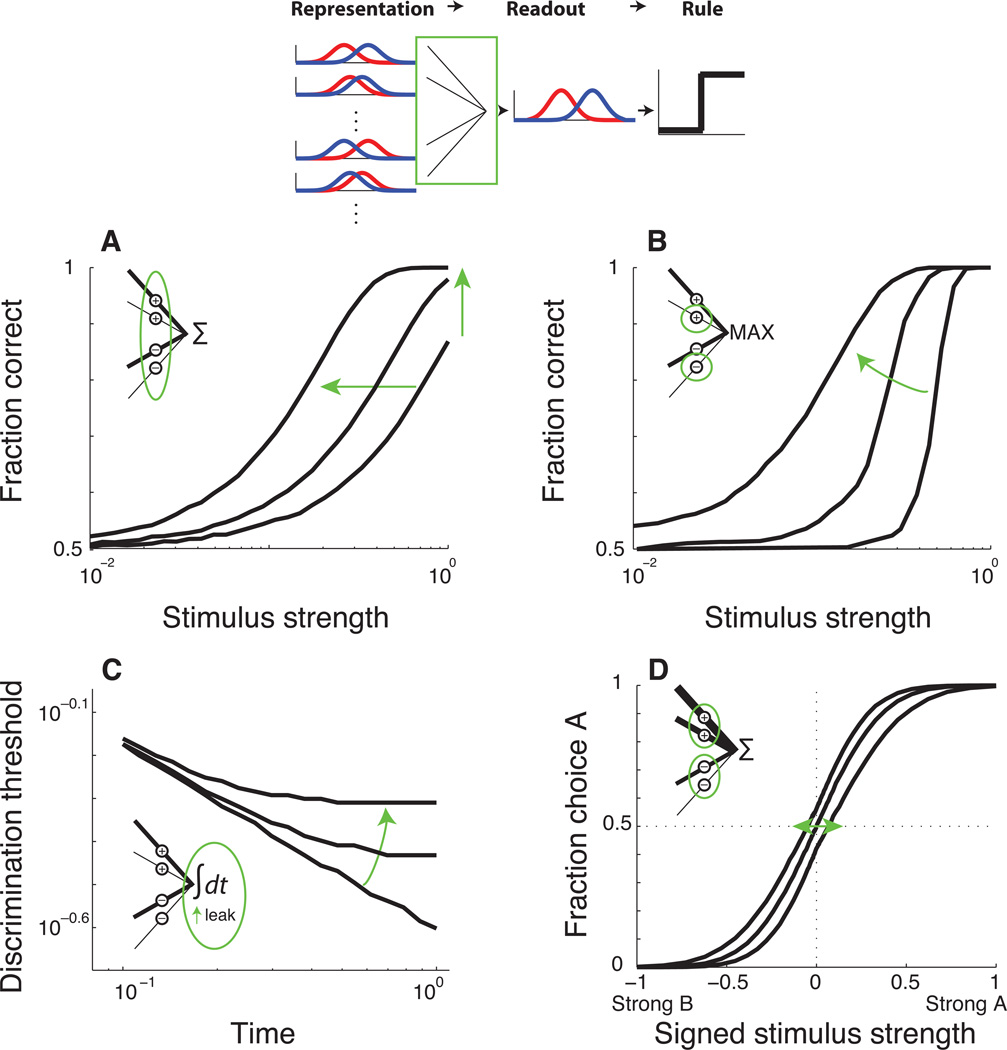
Psychometric functions are often interpreted in the context of Signal Detection Theory, which emphasizes a distinction between sensory processing and non-sensory decision rules in the brain. This framework has helped to relate perceptual sensitivity to the "neurometric" sensitivity of sensory-driven neural activity. However, perceptual sensitivity, as interpreted via Signal Detection Theory, is based on not just how the brain represents relevant sensory information, but also how that information is read out to form the decision variable to which the decision rule is applied. Here we discuss recent advances in our understanding of this readout process and describe its effects on the psychometric function. In particular, we show that particular aspects of the readout process can have specific, identifiable effects on the threshold, slope, upper asymptote, time dependence, and choice dependence of psychometric functions. To illustrate these points, we emphasize studies of perceptual learning that have identified changes in the readout process that can lead to changes in these aspects of the psychometric function. We also discuss methods that have been used to distinguish contributions of the sensory representation versus its readout to psychophysical performance.
Copyright © 2012 Elsevier Ltd. All rights reserved.
Figures

Similar articles
-
Relationships between the threshold and slope of psychometric and neurometric functions during perceptual learning: implications for neuronal pooling.J Neurophysiol. 2010 Jan;103(1):140-54. doi: 10.1152/jn.00744.2009. Epub 2009 Oct 28. J Neurophysiol. 2010. PMID: 19864439 Free PMC article.
-
The basal ganglia's contributions to perceptual decision making.Neuron. 2013 Aug 21;79(4):640-9. doi: 10.1016/j.neuron.2013.07.042. Neuron. 2013. PMID: 23972593 Free PMC article.
-
Sensory discrimination: decision process.J Neurophysiol. 1980 Jun;43(6):1771-92. doi: 10.1152/jn.1980.43.6.1771. J Neurophysiol. 1980. PMID: 6251182
-
Multisensory perceptual learning and sensory substitution.Neurosci Biobehav Rev. 2014 Apr;41:16-25. doi: 10.1016/j.neubiorev.2012.11.017. Epub 2012 Dec 7. Neurosci Biobehav Rev. 2014. PMID: 23220697 Review.
-
Sense, memory, and decision-making in the somatosensory cortical network.Curr Opin Neurobiol. 2012 Dec;22(6):914-9. doi: 10.1016/j.conb.2012.08.002. Epub 2012 Aug 28. Curr Opin Neurobiol. 2012. PMID: 22939031 Review.
Cited by
-
The dorsal medial frontal cortex mediates automatic motor inhibition in uncertain contexts: evidence from combined fMRI and EEG studies.Hum Brain Mapp. 2014 Nov;35(11):5517-31. doi: 10.1002/hbm.22567. Epub 2014 Jun 23. Hum Brain Mapp. 2014. PMID: 24954611 Free PMC article.
-
Adaptive Choice Biases in Mice and Humans.Front Behav Neurosci. 2020 Jul 14;14:99. doi: 10.3389/fnbeh.2020.00099. eCollection 2020. Front Behav Neurosci. 2020. PMID: 32760255 Free PMC article.
-
Developmental trajectory of social influence integration into perceptual decisions in children.Proc Natl Acad Sci U S A. 2019 Jan 28;116(7):2713-2722. doi: 10.1073/pnas.1808153116. eCollection 2019 Feb 12. Proc Natl Acad Sci U S A. 2019. PMID: 30692264 Free PMC article.
-
Localized and global representation of prior value, sensory evidence, and choice in male mouse cerebral cortex.Nat Commun. 2024 May 22;15(1):4071. doi: 10.1038/s41467-024-48338-6. Nat Commun. 2024. PMID: 38778078 Free PMC article.
-
Touch-driven advantages in reaction time but not in performance in a cross-sensory comparison of reinforcement learning.Heliyon. 2024 Dec 20;11(1):e41330. doi: 10.1016/j.heliyon.2024.e41330. eCollection 2025 Jan 15. Heliyon. 2024. PMID: 39839521 Free PMC article.
References
Publication types
MeSH terms
Grants and funding
LinkOut - more resources
Full Text Sources
Other Literature Sources
