. 2012 May 18;31(14):3104-17.
doi: 10.1038/emboj.2012.144.

Identification of a novel Wnt5a-CK1ɛ-Dvl2-Plk1-mediated primary cilia disassembly pathway

Affiliations

Identification of a novel Wnt5a-CK1ɛ-Dvl2-Plk1-mediated primary cilia disassembly pathway

Kyung Ho Lee et al. EMBO J. .

Abstract

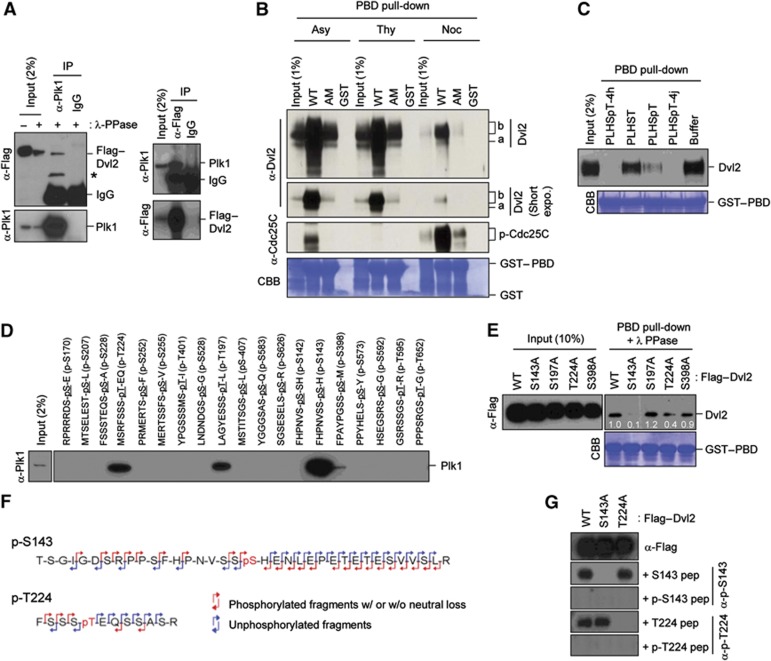
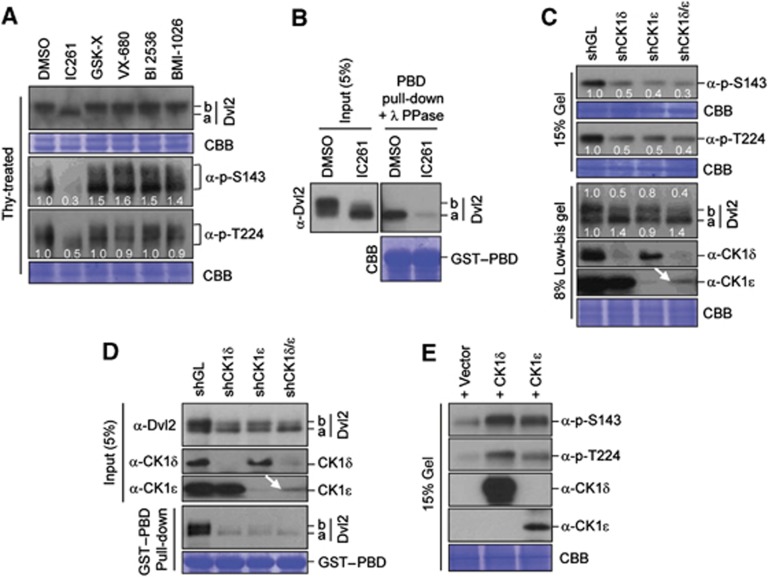
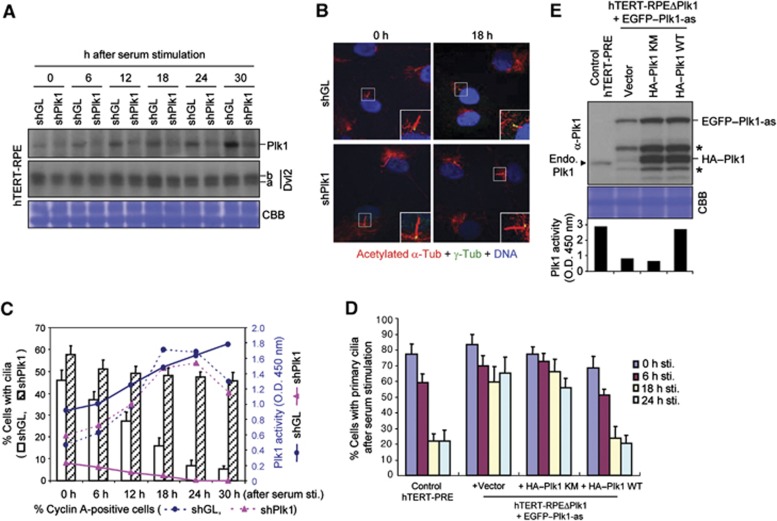
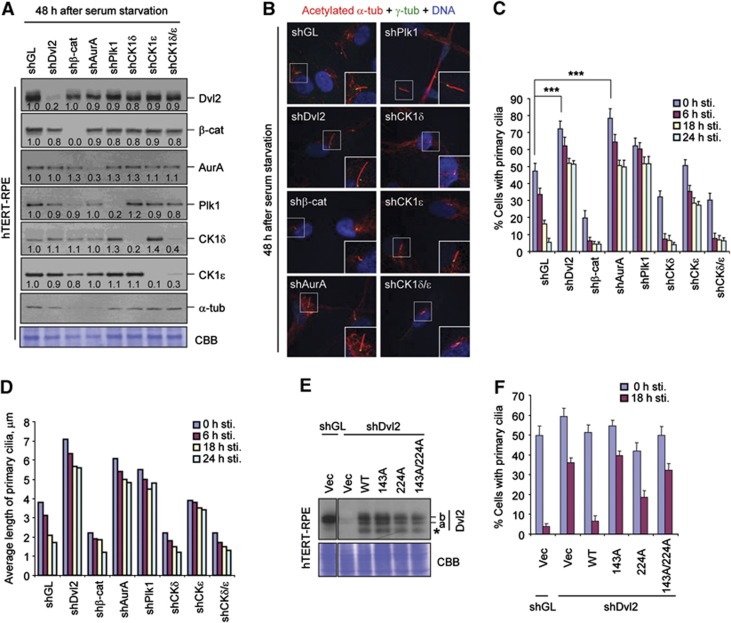
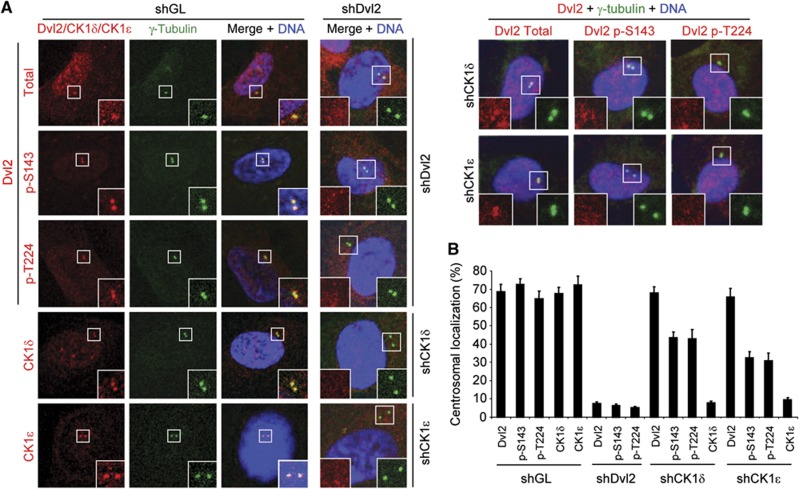
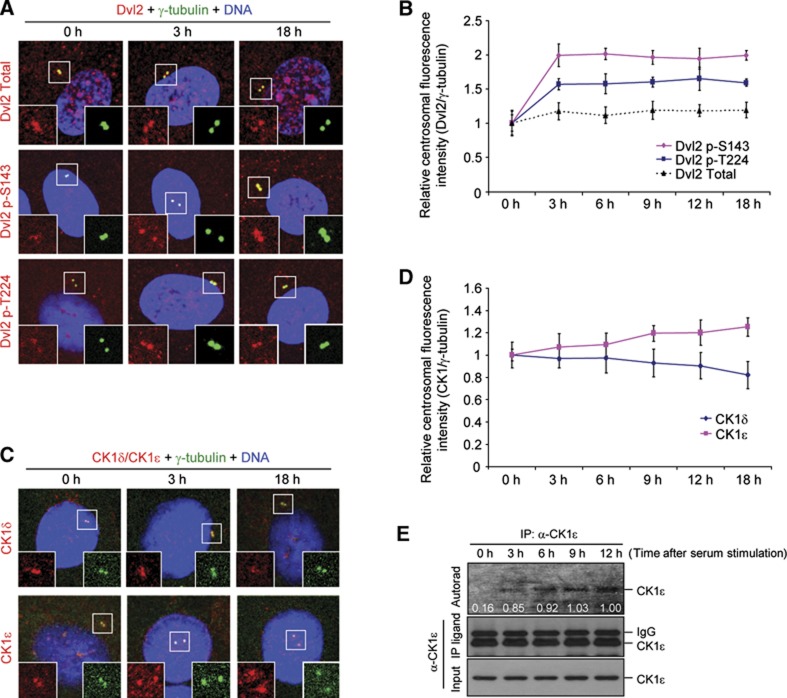
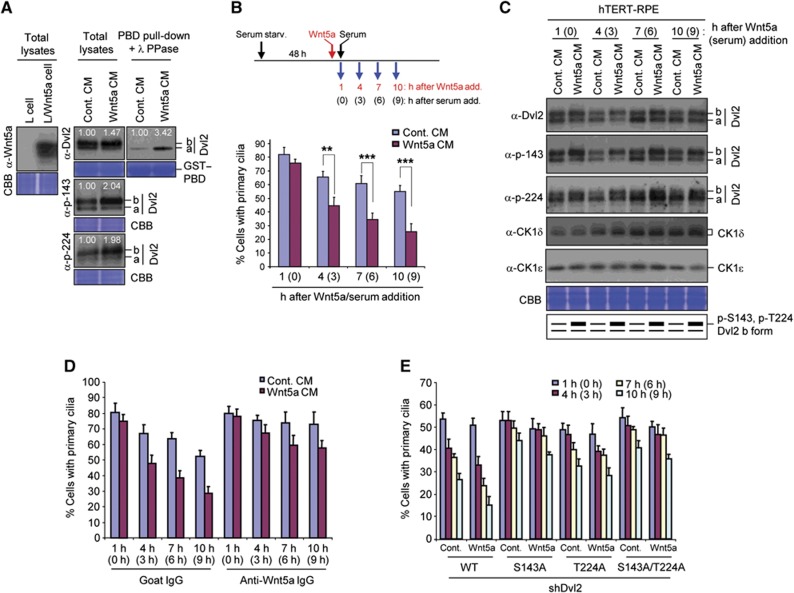
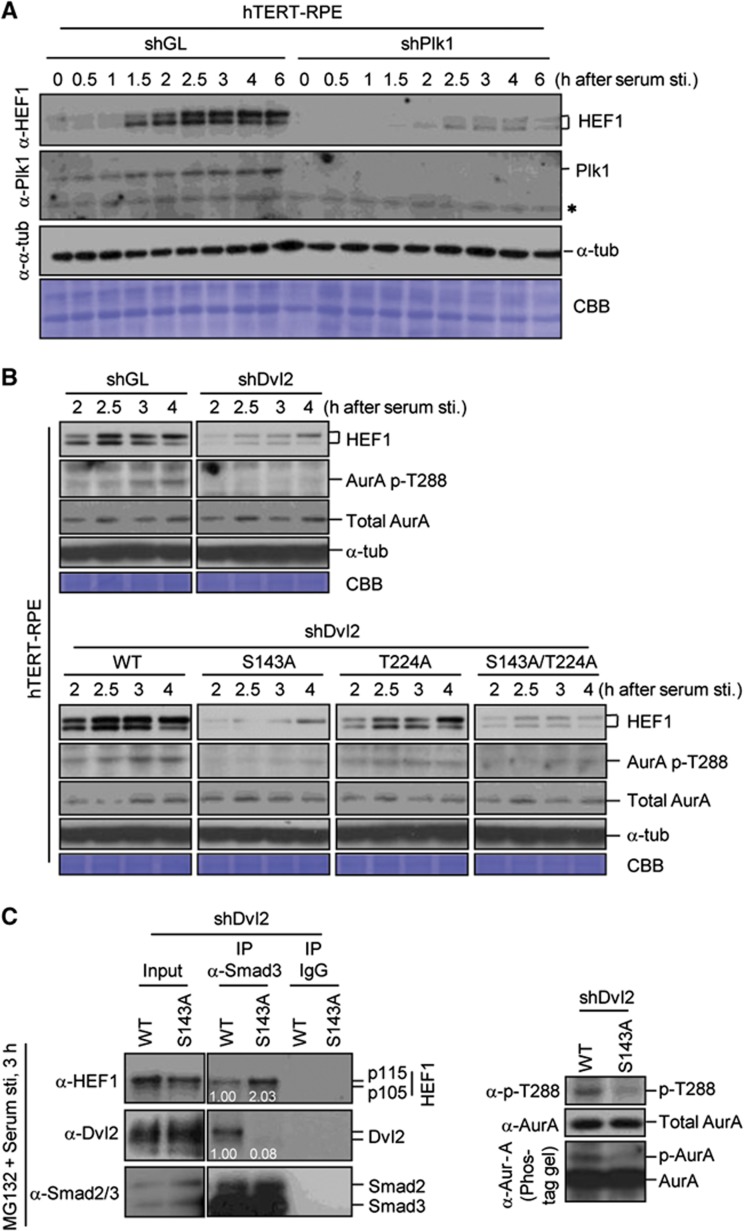
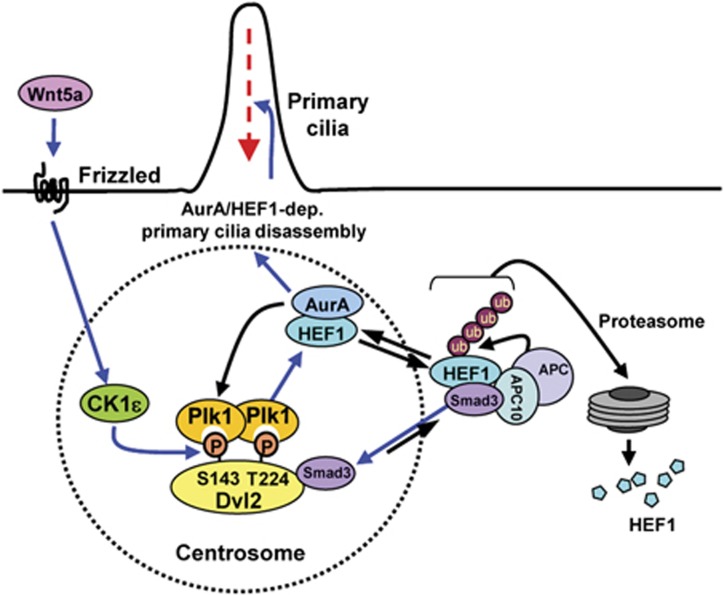
Non-motile primary cilium is an antenna-like structure whose defect is associated with a wide range of pathologies, including developmental disorders and cancer. Although mechanisms regulating cilia assembly have been extensively studied, how cilia disassembly is regulated remains poorly understood. Here, we report unexpected roles of Dishevelled 2 (Dvl2) and interphase polo-like kinase 1 (Plk1) in primary cilia disassembly. We demonstrated that Dvl2 is phosphorylated at S143 and T224 in a manner that requires both non-canonical Wnt5a ligand and casein kinase 1 epsilon (CK1ɛ), and that this event is critical to interact with Plk1 in early stages of the cell cycle. The resulting Dvl2-Plk1 complex mediated Wnt5a-CK1ɛ-Dvl2-dependent primary cilia disassembly by stabilizing the HEF1 scaffold and activating its associated Aurora-A (AurA), a kinase crucially required for primary cilia disassembly. Thus, via the formation of the Dvl2-Plk1 complex, Plk1 plays an unanticipated role in primary cilia disassembly by linking Wnt5a-induced biochemical steps to HEF1/AurA-dependent cilia disassembly. This study may provide new insights into the mechanism underlying ciliary disassembly processes and various cilia-related disorders.


Conflict of interest statement

The authors declare that they have no conflict of interest.

Figures

Figure 1
Figure 1
Interaction between Plk1 PBD and the p-S143 and p-T224 epitopes of Dvl2. (A) HeLa cells transfected with Flag–Dvl2 were subjected to reciprocal immunoprecipitations. Immunoprecipitates were treated with λ phosphatase (PPase) to eliminate phosphorylated and slow-migrating forms and then immunoblotted. Asterisk, degradation product of Flag–Dvl2. (B) Total lysates prepared from asynchronously (Asy) growing, thymidine (Thy)-treated, or Noc-treated HeLa cells were subjected to pull-downs with bead-associated control GST, GST–PBD WT, or GST–PBD (H538A K540M) (AM). Precipitates were immunoblotted and the membrane was stained with Coomassie (CBB). Note that both fast- and slow-migrating Dvl2 forms (arbitrarily referred to as a and b forms, respectively) efficiently bound to GST–PBD (WT), but not to GST–PBD (AM). (C) Lysates from asynchronously growing HeLa cells were mixed with nonphospho-T78 peptide (PLHST), phospho-T78 peptide (PLHSpT), high-affinity PLHSpT derivatives 4h or 4j (Liu et al, 2011), or control buffer. The resulting lysates were then subjected to PBD pull-down as in (B). (D) Bead-immobilized Dvl2-derived peptides were incubated with HeLa lysates, precipitated, and then immunoblotted. (E) HEK293T cells transfected with the indicated Dvl2 constructs were subjected to PBD pull-downs, treated with λ phosphatase (PPase), and analysed. Numbers, relative amounts of Dvl2 bound to GST–PBD. (F) Anti-Flag–Dvl2 immunoprecipitates prepared from transfected HeLa cells arrested with thymidine for 18 h were subjected to mass spectrometry analysis to determine in-vivo phosphorylation site. The phosphorylation site was determined by the phosphorylated (red) MS/MS fragment ions with (w/) or without (w/o) neutral loss of phosphate and unphosphorylated (blue) fragment ions. The full results are shown in Supplementary Figure S2B. (G) HEK293T cells transfected with the indicated Dvl2 constructs were immunoblotted in the presence of 5 μg/ml of the indicated S143 or T224 peptide to determine the specificity of the phospho-antibodies. Figure source data can be found with the Supplementary data.
Figure 2
Figure 2
CK1δ/ε-dependent phosphorylation of Dvl2 at S143 and T224. (A) Thymidine-arrested HeLa cells were treated with the indicated compounds to inhibit CK1δ/ε (IC261), GSK-3β (GSK Inhibitor X), AurA (VX-680), Plk1 (BI 2536), or Cdk (BMI-1026), respectively, and the resulting samples were subjected to immunoblotting analyses. Note only IC261 generated the fast-migrating ‘a’ form and greatly diminished the levels of the p-S143 and p-T224 epitopes. Numbers in (A) indicate relative signal intensities. (B) HeLa cells were treated with control DMSO or IC261 for 3 h and then subjected to PBD pull-downs. Precipitates were treated with λ phosphatase (PPase), immunoblotted, and the resulting membrane was stained with Coomassie (CBB). (CE) Asynchronously growing hTERT-RPE cells were either silenced for control luciferase (GL), CK1δ, CK1ε, or both CK1δ and CK1ε by lentivirus-based shRNA (C, D) or transfected with CK1δ or CK1ε and treated with thymidine for 18 h (E). The resulting cells were then immunoblotted with the indicated antibodies (C, E) or subjected to PBD pull-downs (D). Where indicated, samples were separated by 15% SDS–PAGE to condense the Dvl2 signals for easy quantification or 8% low-bis-acrylamide gel to reveal hyperphosphorylated, slow-migrating proteins. Failure to induce an additive effect of shCK1δ and shCK1ε on the generation of the p-S143 and p-T224 epitopes (C) and in the PBD binding (D) could be in part attributable to the inefficient depletion of CK1ε (arrows). Numbers in (C) indicate signal intensities relative to the signal in the shGL sample. Note that the transfected CK1δ and CK1ε in (E) were overexpressed over their endogenous proteins ∼40 times and 10 times, respectively (data not shown). Figure source data can be found with the Supplementary data.
Figure 3
Figure 3
Requirement of Plk1 activity for proper disassembly of primary cilia. (A, B) hTERT-RPE cells were infected with lentiviruses expressing shGL or shPlk1. Forty-eight hours after serum starvation, the cells were stimulated with serum, harvested, and then subjected to immunoblotting (A) and immunostaining (B) analyses. Magnified images of cilia are shown in the enlarged boxes in (B). (C) From the immunostained samples in (B), cells with primary cilia were quantified (bar graphs). A fraction of the total lysates in (A) was used to determine Plk1 activity using an ELISA-based assay (solid lines) (Park et al, 2009). To monitor cell-cycle progression, Cyclin A-positive cells were quantified (dotted lines). Error bars, standard deviation from more than three independent experiments. Note that a low but significant level of Plk1 activity was detectable even at the early stages after serum stimulation. (D) Control parental hTERT-RPE cells or hTERT-RPE Plk1-as cells lacking endogenous Plk1 but expressing the indicated constructs were starved for 48 h and stimulated with serum. The resulting cells were fixed at the indicated time points after stimulation and immunostained as in (B) to quantify the cells with primary cilia. Error bars, standard deviation. (E) Total lysates prepared from the 24-h samples in (D) were subjected to immunoblotting analyses and ELISA-based kinase assays (graph) to determine the level of Plk1 activity. Arrowhead indicates endogenous Plk1 that is not detectable in the hTERT-RPE Plk1-as cells deleted of the genomic PLK1 locus. Asterisks, EGFP–Plk1 degradation products. For graphs in (C, D), >300 cells were counted from the samples at each time point. Figure source data can be found with the Supplementary data.
Figure 4
Figure 4
Induction of primary cilia disassembly by the CK1ε-dependent Plk1–Dvl2 p-S143/p-T224 complex. (AD) hTERT-RPE cells infected with the indicated sh-lentiviruses were first starved for 48 h. A set of the resulting cells was harvested for immunoblotting (A) or immunostaining (B) analyses. Enlarged images of cilia are shown in the boxes at the bottom right corner (B). Another set of the starved cells was subsequently stimulated with serum, fixed at the indicated time point, and immunostained. The cells with primary cilia were then counted (C) and the average lengths of primary cilia among cilia-positive cells were quantified (D). Numbers in (A) indicate signal intensities relative to α-tubulin signals. Both anti-α-tubulin immunoblotting and Coomassie (CBB) staining were carried out for loading controls. Error bars, standard deviation from more than three independent experiments. Statistics: ***P<0.001 (unpaired two-tailed t-test). (E, F) hTERT-RPE cells expressing the indicated constructs were infected with lentivirus expressing either control shGL or shDvl2, and then immunoblotted (E). The resulting cells were starved for 48 h and then stimulated with serum. The cells harvested at the indicated time points after serum stimulation were immunostained and quantified (F). Note that cells infected with lentiviruses (expression or RNAi viruses) exhibited less efficient primary cilia formation. Asterisk, degradation product. Error bars, standard deviation from more than three independent experiments. For samples in (C, D, F), >300 cells were counted for each sample. Figure source data can be found with the Supplementary data.
Figure 5
Figure 5
Centrosomal localization of Dvl2 p-S143/p-T224, CK1δ, and CK1ε in hTERT-RPE cells. (A, B) Asynchronously growing hTERT-RPE cells were silenced for either control luciferase (shGL), shDvl2, shCK1δ, or shCK1ε, and the resulting cells were then immunostained with the indicated antibodies after extraction with 0.5% Triton X-100 (A) and quantified (B). More than 300 cells from each of three independent experiments were counted for each sample. Error bars, standard deviation.
Figure 6
Figure 6
Differential regulation of centrosome-localized Dvl2 p-S143/p-T224, CK1δ, and CK1ε signals following serum stimulation. (AD) Forty-eight hours after serum starvation, hTERT-RPE cells were stimulated with serum for the indicated lengths of time. The resulting cells were then immunostained (A, C) and centrosomal fluorescence intensities were quantified (B, D). Signal intensities from >50 cells in (B, D) were quantified for each time point from three independent experiments. Error bars, standard deviation from three independent experiments. (E) Cells prepared similarly as in (AD) were subjected to immunoprecipitation kinase assays in the presence of [γ-32P]ATP, and the resulting samples were analysed by autoradiogram and immunoblotting analyses. Figure source data can be found with the Supplementary data.
Figure 7
Figure 7
Regulation of primary cilia disassembly by Wnt5a-dependent formation of the Dvl2–Plk1 complex. (A) Total cellular lysates prepared from mouse L fibroblasts expressing either control vector or Wnt5a were subjected to immunoblotting analyses (left). hTERT-RPE cells serum starved for 24 h were treated with either control or Wnt5a-containing CM for 6 h, harvested, and subjected to PBD pull-downs. Precipitates were treated with λ phosphatase (PPase) before analyses (right). Numbers indicate the levels of the Dvl2 b form or total Dvl2 bound to PBD. (B, C) hTERT-RPE cells serum starved for 48 h were treated with either control or Wnt5a CM 1 h prior to serum stimulation. The cells harvested at the indicated time points after the stimulation were immunostained and quantified (B) or immunoblotted (C). Statistics: **P<0.01, ***P<0.001 (unpaired two-tailed t-test). Note that treatment of cells with Wnt5a CM enhances the levels of the p-S143 and p-T224 epitopes as early as 1 h after the treatment. Error bars, standard deviation from more than three independent experiments. (D) hTERT-RPE cells serum starved for 48 h were treated with control or Wnt5a CM pre-incubated with either control IgG or anti-Wnt5a IgG. One hour after the treatment, cells were stimulated with serum, fixed according to the schedule in (B), immunostained, and quantified. Error bars, standard deviation. (E) hTERT-RPE cells expressing various Dvl2 constructs were depleted of endogenous Dvl2, serum starved for 48 h, and treated with control or Wnt5a CM for 1 h prior to serum stimulation. The cells were fixed according to the schedule in (B), immunostained, and quantified. The efficiency of primary cilia generation was somewhat diminished in the cells doubly infected with lentiviruses (for expression and RNAi viruses). For the quantification in (B, D, E), >300 cells were counted for each sample. Error bars, standard deviation from more than three independent experiments. Figure source data can be found with the Supplementary data.
Figure 8
Figure 8
Regulation of HEF1 stability and AurA activity by the Dvl2–Plk1 complex. (A) hTERT-RPE cells silenced for either control luciferase (shGL) or Plk1 (shPlk1) were serum starved for 48 h. Following serum stimulation, samples were harvested at the indicated time points and immunoblotted. The same membrane was stained with Coomassie (CBB). (B) Various hTERT-RPE cells silenced for either control luciferase (shGL) or Dvl2 (shDvl2) were serum starved for 48 h. Following serum stimulation, cells were harvested for immunoblotting analyses. Note that the levels of HEF1 and the AurA p-T288 epitope were greatly diminished in the shDvl2, the S143A, and the S143A/T224A double mutant cells. (C) hTERT-RPE cells expressing WT Dvl2 or the S143A mutant were depleted of endogenous Dvl2, serum starved for 48 h, and treated with MG132 for 2 h prior to serum stimulation. Cells harvested 3 h after serum stimulation were subjected to immunoprecipitation analyses (left). Smad2 was detectable in the Smad3 immunoprecipitates because of the interaction between these two proteins. Total lysates were immunoblotted (right) to determine the level of AurA phosphorylation by 10% SDS–PAGE without (upper and middle) or with 50 μM Phos-tag (0.2 mmol/l MnCl2(H2O)4 and 0.02 mmol/l Phos-tag acrylamide AAL-107) (Zeng et al, 2010) (lower). Figure source data can be found with the Supplementary data.
Figure 9
Figure 9
Model illustrating primary cilia disassembly by the Wnt5a–CK1ε–Dvl2–Plk1 axis. Wnt5a stimulation triggers CK1ε-dependent phosphorylation of Dvl2 at S143 and T224, and induces the formation of the Dvl2–Plk1 complex. Dvl2-bound Plk1 enhances the Dvl2–Smad3 interaction, thus diminishing the level of the HEF1 population associating with the Smad3/APC10-containing APC complex (Liu et al, 2000; Nourry et al, 2004) (see the unequal blue arrow). This event leads to the stabilization of HEF1, and therefore activation of HEF1/AurA-dependent cilia disassembly pathway. Loss of the p-S143/p-T224-dependent Dvl2–Plk1 interaction reverses this event by enhancing the Smad3–HEF1 interaction and the Smad3–APC10-dependent HEF1 degradation. Since AurA has been shown to phosphorylate and activate Plk1 (Macůrek et al, 2008; Seki et al, 2008), the AurA/HEF1 complex may activate Plk1 in a positive-feedback loop. Blue arrows denote Wnt5a-induced primary cilia disassembly pathway.

References

    1. Adams M, Smith UM, Logan CV, Johnson CA (2008) Recent advances in the molecular pathology, cell biology and genetics of ciliopathies. J Med Genet 45: 257–267 - PubMed
    1. Alieva IB, Gorgidze LA, Komarova YA, Chernobelskaya OA, Vorobjev IS (1999) Experimental model for studying the primary cilia in tissue culture cells. Membr Cell Biol 12: 895–905 - PubMed
    1. Angers S, Moon RT (2009) Proximal events in Wnt signal transduction. Nat Rev Mol Cell Biol 10: 468–477 - PubMed
    1. Archambault V, Glover DM (2009) Polo-like kinases: conservation and divergence in their functions and regulation. Nat Rev Mol Cell Biol 10: 265–275 - PubMed
    1. Barr FA, Sillje HH, Nigg EA (2004) Polo-like kinases and the orchestration of cell division. Nat Rev Mol Cell Biol 5: 429–440 - PubMed

Publication types

MeSH terms

Substances