. 2012 May 20;30(6):521-30.
doi: 10.1038/nbt.2205.

Inferring gene regulatory logic from high-throughput measurements of thousands of systematically designed promoters

Affiliations

Inferring gene regulatory logic from high-throughput measurements of thousands of systematically designed promoters

Eilon Sharon et al. Nat Biotechnol. .

Abstract

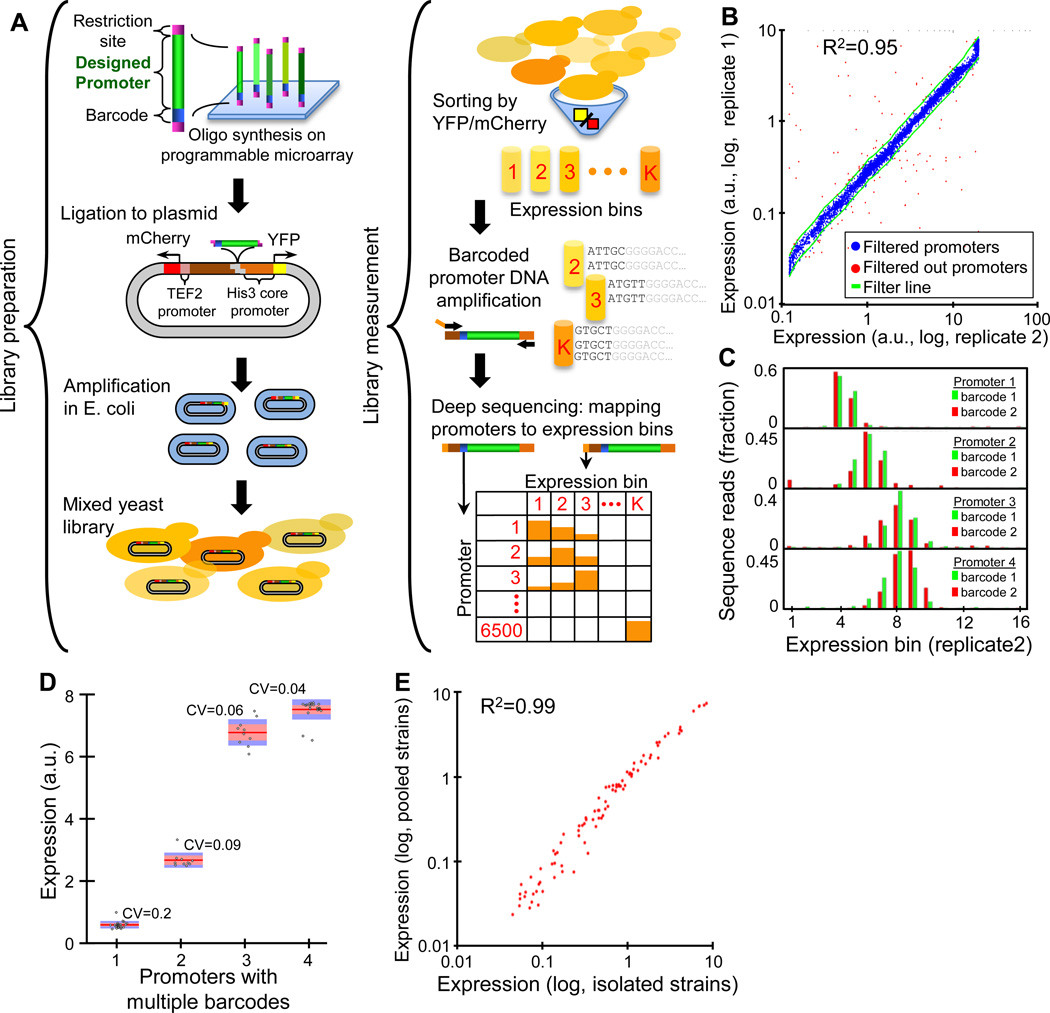
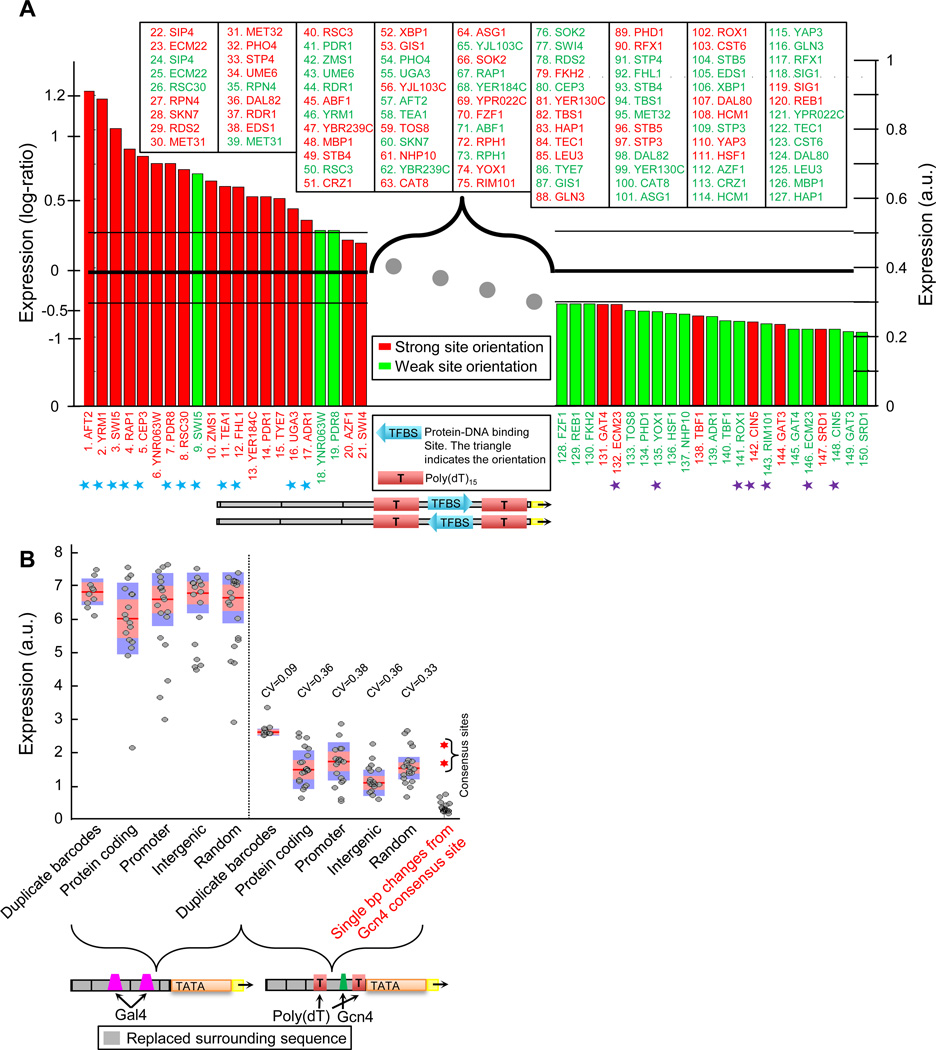
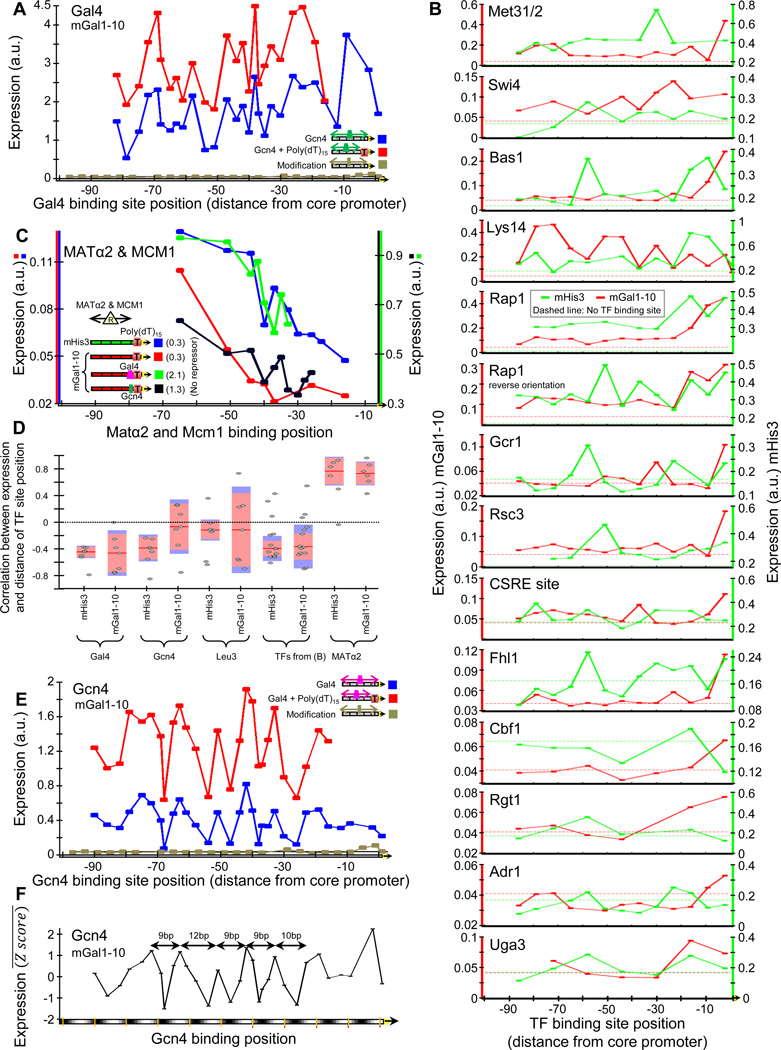
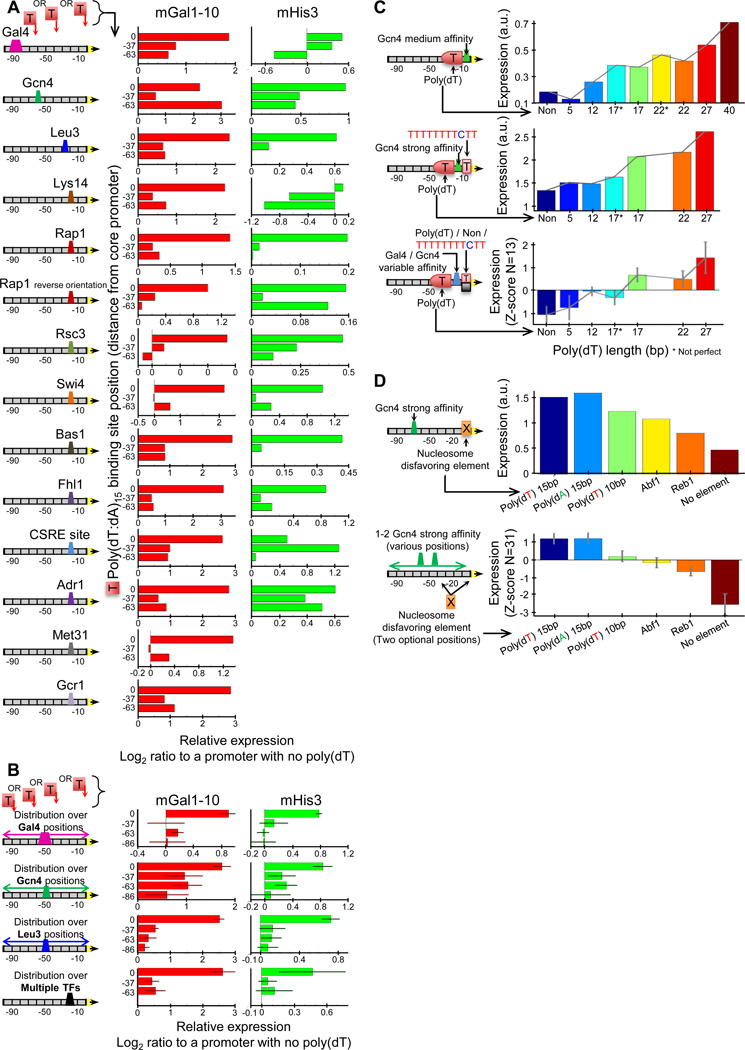
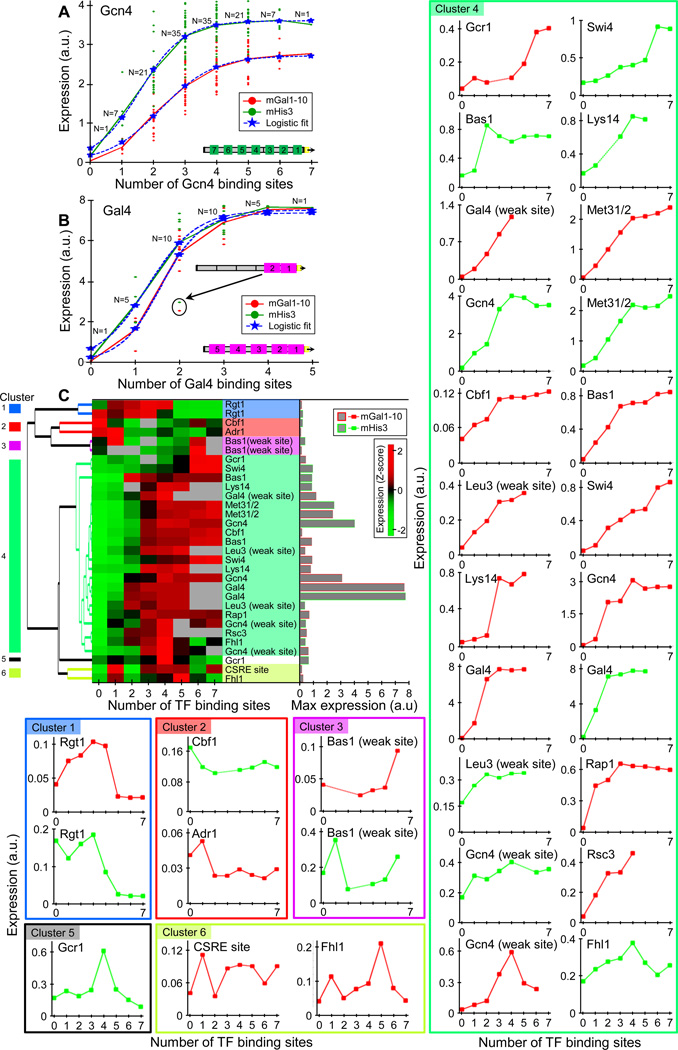
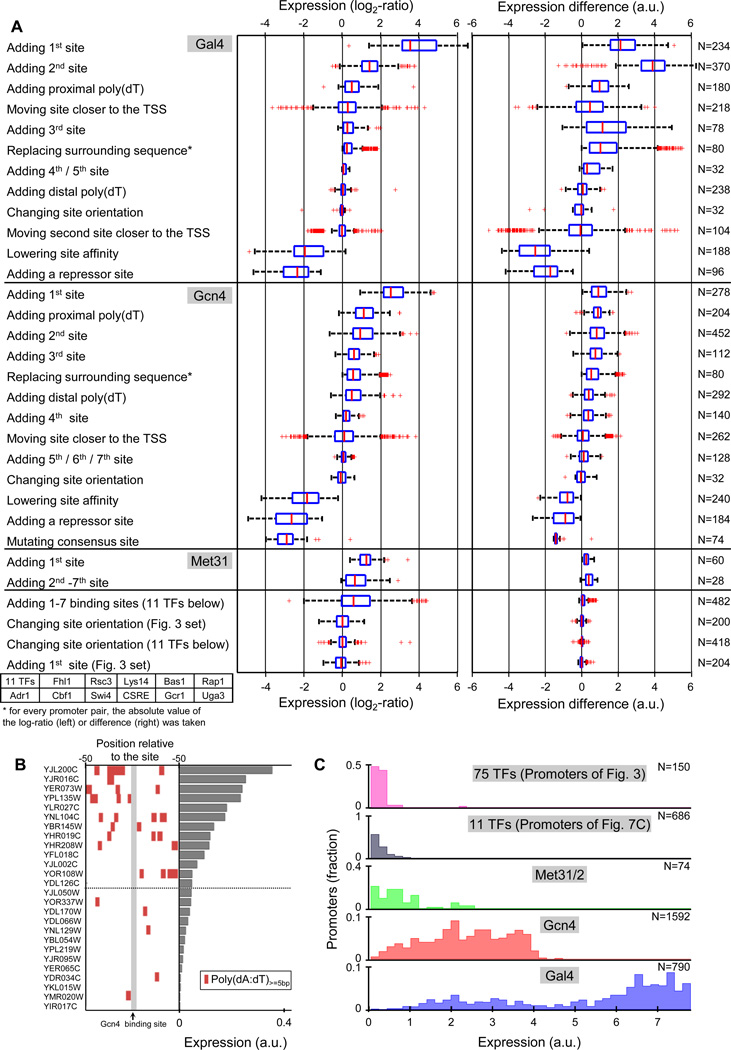
Despite extensive research, our understanding of the rules according to which cis-regulatory sequences are converted into gene expression is limited. We devised a method for obtaining parallel, highly accurate gene expression measurements from thousands of designed promoters and applied it to measure the effect of systematic changes in the location, number, orientation, affinity and organization of transcription-factor binding sites and nucleosome-disfavoring sequences. Our analyses reveal a clear relationship between expression and binding-site multiplicity, as well as dependencies of expression on the distance between transcription-factor binding sites and gene starts which are transcription-factor specific, including a striking ∼10-bp periodic relationship between gene expression and binding-site location. We show how this approach can measure transcription-factor sequence specificities and the sensitivity of transcription-factor sites to the surrounding sequence context, and compare the activity of 75 yeast transcription factors. Our method can be used to study both cis and trans effects of genotype on transcriptional, post-transcriptional and translational control.


Figures

Figure 1
Figure 1. Obtaining accurate expression measurements for thousands of designed promoter sequences
(A) Illustration of our experimental method. (B) Our method obtains highly reproducible expression measurements. Shown is a comparison of expression measurements (log-scale) obtained for two independent replicates done using two different cell sorting strategies (y-axis, replicate 1 sorted into 64 bins; x-axis, replicate 2 sorted into 16 bins, see Methods), along with lines (green) that correspond to a difference of 30% from the mean of the two replicates. 114 (1.75%) of the 6500 promoters that we designed fell outside the green lines and were filtered out from our analyses. (C) Barcodes have little effect on our expression measurements. Shown is the distribution of sequencing reads across the expression bins that we obtained for four pairs of promoters that differ only in their barcode sequence. See Fig. S2 for 14 additional such promoter pairs. (D) Similar to (C), but for four sets of promoters where each set contains 10 (columns 3–4) or 20 (columns 1–2) promoters that differ only in their barcode sequence. For each set, shown are the individual expression measurements (gray dots), and their median (red line), standard error (orange bar), standard deviation (blue bar), and coefficient of variation (CV, standard deviation divided by the mean). (E) Our method obtains highly accurate expression measurements. We isolated 92 individual strains from our pool of transformed yeast cells and sequenced each of them to reveal their identity. Shown is a comparison of the expression for these strains when each strain was measured in isolation using a flow cytometer (x-axis) or within a single experiment using our method (y-axis).
Figure 2
Figure 2. Profiling the activity of most yeast transcription factors
(A) Consensus binding sites for 75 yeast transcription factors were separately inserted in their two possible orientations at the same position within a fixed promoter context (bottom illustration). Shown is a ranking of the resulting expression levels for each promoter, with the two site orientations of each TF colored red and green depending on whether they correspond to the orientation with higher or lower expression, respectively. For brevity, individual measurements for promoters with intermediate expression levels are not given (TF sites and their internal ranking are indicated in the box). Cyan and purple asterisks correspond to TFs with literature-reported activating or repressive roles, respectively. A horizontal black line marks the expression of the same fixed promoter above but without any known TF binding site, and the two thin lines above and below this line mark a confidence level of 30% around it. Y-axes show both the absolute expression levels (right axis) and the (log) ratio of expression to that of a promoter without a binding site (left axis). (B) Surrounding sequence has a significant yet limited effect on expression of regulatory elements and is similar for different types of surrounding sequences. Shown are the expression levels of promoters in which a regulatory block consisting of two Gal4 binding sites (left five columns) or of a single Gcn4 binding site flanked by two nucleosome disfavoring sequences (right five columns) were placed at the same position within different types of surrounding sequence contexts. The sequence contexts were chosen randomly from yeast protein coding regions (20 sequences), yeast promoters (20 sequences), yeast intergenic regions that are not promoters (20 sequences), and 20 sequences were generated randomly using the same G/C content as that of yeast promoters (G/C=40%, 20 sequences). For comparison, each regulatory block was also placed 20 different times within the same promoter but each time with a different barcode (columns 1 and 6). For each set, shown are the individual promoter expression levels (gray dots), and their median (red line), standard error (orange bar), and standard deviation (blue bar), and coefficient of variation (CV, standard deviation divided by the mean). As another comparison for the effect of surrounding sequence on expression, the rightmost column shows the expression levels of all 21 promoters from Fig. S6A in which we mutated a single basepair in the Gcn4 consensus site (gray points), along with the expression of a promoter that contains the consensus or its reverse complement (red points).
Figure 3
Figure 3. The effect of binding site location on expression
(A) Expression depends on Gal4 site location. Shown are the expression levels of promoters in which we inserted the consensus site for Gal4 at different locations (in 3–4bp increments) within two fixed promoter backgrounds (red and blue lines, backgrounds differ by the presence of a poly(dA:dT) tract). Points correspond to the location in the promoter of the rightmost basepair of the Gal4 site. For comparison, shown are the expression levels of the original promoter with no Gal4 sites (black line) and of promoters (gray) in which random mutations of 3bp each time were performed across the non-poly(dA:dT) promoter, indicating that the effect of changing the location of Gal4 sites is not due to removal of the original promoter sequence. (B) Same as (A), for 14 additional TFs whose sites we varied at 7bp increments in two different promoter backgrounds. (C) The effect of repressor sites decays with their distance from the core promoter. For the Matα2p-Mcm1p repressor complex, shown are four sets of promoters in which we modified the location of its site along the promoter, where the four sets differ by the presence of poly(dA:dT) tracts and sites for the transcriptional activators Gcn4 and Gal4. For each of the four sets, the expression of the promoter without the repressor site is indicated in the inset legend and is higher than all promoters that contain the repressor site, as expected. (D) The effect of TFs on expression shows a general trend of decay with the distance between their sites and the core promoter. For each set of promoters in which we changed the location of a TF binding site within the same promoter background, we computed the correlation between the expression at each location and the distance of the TF site at that location from the core promoter. Shown are the resulting correlations, where for Gal4, Gcn4, Leu3, and Matα2p-Mcm1p, each column groups together correlations of promoter sets for the same TF in backgrounds that differ in the presence of poly(dA:dT) tracts and for all other TFs that were each done in two distinct promoter backgrounds, correlations are grouped by backgrounds. For each column, the median (red line), standard error (orange bar), and standard deviation (blue bar) of the correlations are shown. Note the trend of negative correlation between expression and site distance for all TFs except the repressor Matα2p- Mcm1p for which there is a positive correlation. (E) Expression changes as a ~10bp periodic function of Gcn4 site location. Same as (A), but for Gcn4 sites. (F) Same as (E), but here each point corresponds to the average expression level of 8 sets of promotes in which we changed the location of the Gcn4 site, where the 8 different sets differ in the location of a poly(dA:dT) tract of length 15bp. To normalize the expression levels across the 8 different sets, expression is shown as a robust Z-score, by subtracting the median and dividing by the standard deviation of expression level differences from the median. Note the ~10bp periodicity of expression observed over 5 periods (distances between neighboring peaks of expression level are indicated, with x-axis colors matching 10.5bp periodicity).
Figure 4
Figure 4. The effect of nucleosome disfavoring sequences on expression
(A) Addition of nucleosome disfavoring sequences near TF sites increases expression. Shown are expression levels for 14 sets of promoters in which a poly(dA:dT) tract of length 15bp was separately inserted at various locations within two promoter backgrounds that each contain a TF binding site at some fixed position. For each set, each bar corresponds to the (log) ratio between the expression of a promoter that contains the poly(dA:dT) tract and the expression of the same promoter in which the poly(dA:dT) is not present. (B) Same as (A), but here each bar shows the median and standard error of the expression obtained for promoters in which the poly(dA:dT) was at a fixed position and the location of the TF site varied. The fourth row (‘multiple TFs’) represents the average of the last 11 TFs from (A). (C) The stimulatory effect of poly(dA:dT) tracts increases with their length. Shown are expression levels for two sets of promoters (first two rows) in which sites with different affinities for Gcn4 were separately placed at a fixed location within different promoter backgrounds that contained poly(dA:dT) tracts of varying lengths at a fixed promoter location. Also shown (bottom row) is the median and standard error of expression for promoters with various TF sites and site affinities. (D) The stimulatory effect of poly(dA:dT) tracts can be greater than that of the general TF activators Reb1p and Abf1p. Shown is the expression of promoters in which different elements (no element, Reb1p site, Abf1p site, 10bp poly(dA:dT) tract, 15bp tract, 15bp tract flipped in its orientation) were placed at the same location within a promoter background that contains a consensus Gcn4 site at a fixed location (top row). For each element, also shown is the average and standard deviation of expression of promoters in which it was inserted at two possible positions within 31 different promoter backgrounds that differ in the number and location of Gcn4 sites and the surrounding sequence (bottom row). To normalize the expression levels across the promoters of each set, expression is shown as a robust Z-score, by subtracting the median and dividing by the standard deviation of distances from the median.
Figure 5
Figure 5. The effect of binding site number on expression
(A) Expression level is, on average, a monotonic function of Gcn4 sites that mostly saturates at 3–4 sites. Within two different promoter backgrounds, we separately inserted Gcn4 sites in all 27=128 possible combinations of sites at seven predefined locations within the promoter. For each background, shown are the individual promoter expression levels and mean level of all promoters that have k Gcn4 sites, for k=0, 1, 2, …, 7. Also shown is a fit of a logistic function for each background. (B) Same as (A), but for all 25=32 possible combinations of Gal4 sites at five predefined promoter locations. The outlier promoter in terms of expression level in which the two Gal4 sites closest to the core promoter were both added is indicated. These two sites were added at a distance of 1bp as opposed to a 5bp distance between all other adjacent sites, thus suggesting steric hindrance between Gal4 sites at this distance. (C) For many TFs, expression is generally a monotonically increasing function of the number of sites. Shown is a hierarchical clustering and heatmap of the expression profile of 31 sets of promoters where in each set, the same TF site was inserted in k copies within the same promoter background, for k=0,1,2,…,7. Within the heatmap, expression profiles of each TF site were normalized to have mean zero and standard deviation one. The 31 sets correspond to 18 different TF sites (15 different TFs, as 3 TFs have two site variants differing in their affinity) with each site inserted in two different promoter backgrounds. Also shown (right bars) is the absolute expression level of the strongest promoter for each TF site, demonstrating that the expression level at saturation differed greatly among the different TF sites. We defined six clusters from the hierarchical clustering based on the correlations between the expression profiles of the various TFs, and the expression profiles for the individual TF sites of every cluster are shown within colored boxes (right and bottom).
Figure 6
Figure 6. Comparing the effect of different types of sequence changes
(A) Shown are the effects on expression of different types of sequence changes, either as the change in the (log) ratio (left panel) or absolute levels (right panel) of expression. In every row, the boxplot summarizes the effect of a particular type of sequence change (indicated by the text on the left), where each point in the boxplots compares the expression of a promoter in which the change was done to the expression of the same promoter without the change. The first block of changes (12 types) represents changes to Gal4 sites or promoter containing Gal4 sites, the second block to Gcn4 (13 types), the third to Met31 (2 types), and the final block (4 types) pulls together changes to 11 different TFs. The number of promoters used in each boxplot is indicated on the right. In each block, rows are sorted by their effect on the ratio of expression (left panel). (B) Native yeast promoters with poly(dA:dT) tracts near Gcn4 consensus sites have higher expression. Shown is the expression level (right bars, promoters are sorted by expression) of 26 native yeast promoters that contain a consensus Gcn4 site, along with the distribution of poly(dA:dT) tracts that are at least 5bp in length in the 100bp surrounding the Gcn4 site (left heatmap). Each promoter was measured by the fluorescence of a strain in which it was fused to a YFP reporter as described in Zeevi et al.. Note the enrichment of poly(dA:dT) in the more highly expressed promoters. (C) The expression levels of promoters with Gal4 or Gcn4 sites is much higher than that of all promoters with sites for other TFs. Shown is the distribution of expression levels for five different promoter sets, representing promoters with single sites for 75 different TFs (first row); promoters with various manipulations to sites for 11 different TFs, including promoters with up to seven sites for each of these TFs (second row); all of the promoters that contain only Met31/2 sites (third row), Gcn4 sites (fourth row), and Gal4 sites (fifth row). The last three rows include all of the manipulations that we did to promoters with sites for these TFs.

Comment in

References

    1. Chiang DY, Nix DA, Shultzaberger RK, Gasch AP, Eisen MB. Flexible promoter architecture requirements for coactivator recruitment. BMC Mol Biol. 2006;7:16. - PMC - PubMed
    1. Ligr M, Siddharthan R, Cross FR, Siggia ED. Gene expression from random libraries of yeast promoters. Genetics. 2006;172:2113–2122. - PMC - PubMed
    1. Kinkhabwala A, Guet CC. Uncovering cis regulatory codes using synthetic promoter shuffling. PLoS One. 2008;3:e2030. - PMC - PubMed
    1. Gertz J, Siggia ED, Cohen BA. Analysis of combinatorial cis-regulation in synthetic and genomic promoters. Nature. 2009;457:215–218. - PMC - PubMed
    1. Cox RS, 3rd, Surette MG, Elowitz MB. Programming gene expression with combinatorial promoters. Mol Syst Biol. 2007;3:145. - PMC - PubMed

Publication types

Associated data