Release of TGFβig-h3 by gastric myofibroblasts slows tumor growth and is decreased with cancer progression
- PMID: 22610072
- PMCID: PMC3499060
- DOI: 10.1093/carcin/bgs180
Release of TGFβig-h3 by gastric myofibroblasts slows tumor growth and is decreased with cancer progression
Abstract
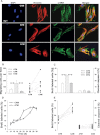
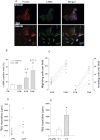
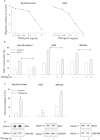
Tumor progression has been linked to changes in the stromal environment. Myofibroblasts are stromal cells that are often increased in tumors but their contribution to cancer progression is not well understood. Here, we show that the secretomes of myofibroblasts derived from gastric cancers [cancer-associated myofibroblasts (CAMs)] differ in a functionally significant manner from those derived from adjacent tissue [adjacent tissue myofibroblasts (ATMs)]. CAMs showed increased rates of migration and proliferation compared with ATMs or normal tissue myofibroblasts (NTMs). Moreover, conditioned medium (CM) from CAMs significantly stimulated migration, invasion and proliferation of gastric cancer cells compared with CM from ATMs or NTMs. Proteomic analysis of myofibroblast secretomes revealed decreased abundance of the extracellular matrix (ECM) adaptor protein like transforming growth factor-β-induced gene-h3 (TGFβig-h3) in CAMs, which was correlated with lymph node involvement and shorter survival. TGFβig-h3 inhibited IGF-II-stimulated migration and proliferation of both cancer cells and myofibroblasts, and suppressed IGF-II activation of p42/44 MAPkinase; TGFβig-h3 knockdown increased IGF-II- and CM-stimulated migration. Furthermore, administration of TGFβig-h3 inhibited myofibroblast-stimulated growth of gastric cancer xenografts. We conclude that stromal cells exert inhibitory as well as stimulatory effects on tumor cells; TGFβig-h3 is a stromal inhibitory factor that is decreased with progression of gastric cancers.
Figures


Similar articles
-
Distinct miRNA profiles in normal and gastric cancer myofibroblasts and significance in Wnt signaling.Am J Physiol Gastrointest Liver Physiol. 2016 May 1;310(9):G696-704. doi: 10.1152/ajpgi.00443.2015. Epub 2016 Mar 3. Am J Physiol Gastrointest Liver Physiol. 2016. PMID: 26939869 Free PMC article.
-
The neuroendocrine phenotype of gastric myofibroblasts and its loss with cancer progression.Carcinogenesis. 2014 Aug;35(8):1798-806. doi: 10.1093/carcin/bgu086. Epub 2014 Apr 7. Carcinogenesis. 2014. PMID: 24710625 Free PMC article.
-
Increased expression of chemerin in squamous esophageal cancer myofibroblasts and role in recruitment of mesenchymal stromal cells.PLoS One. 2014 Aug 15;9(7):e104877. doi: 10.1371/journal.pone.0104877. eCollection 2014. PLoS One. 2014. PMID: 25127029 Free PMC article.
-
Glucagon-like petide-2 acts on colon cancer myofibroblasts to stimulate proliferation, migration and invasion of both myofibroblasts and cancer cells via the IGF pathway.Peptides. 2017 May;91:49-57. doi: 10.1016/j.peptides.2017.03.008. Epub 2017 Mar 29. Peptides. 2017. PMID: 28363795
-
The corneal fibrosis response to epithelial-stromal injury.Exp Eye Res. 2016 Jan;142:110-8. doi: 10.1016/j.exer.2014.09.012. Exp Eye Res. 2016. PMID: 26675407 Free PMC article. Review.
Cited by
-
Cell cycle dependent expression of the CCK2 receptor by gastrointestinal myofibroblasts: putative role in determining cell migration.Physiol Rep. 2017 Oct;5(19):e13394. doi: 10.14814/phy2.13394. Epub 2017 Oct 16. Physiol Rep. 2017. PMID: 29038353 Free PMC article.
-
Transcriptional landscape of the embryonic chicken Müllerian duct.BMC Genomics. 2020 Oct 2;21(1):688. doi: 10.1186/s12864-020-07106-8. BMC Genomics. 2020. PMID: 33008304 Free PMC article.
-
Cancer Associated Fibroblasts: The Architects of Stroma Remodeling.Proteomics. 2018 Mar;18(5-6):e1700167. doi: 10.1002/pmic.201700167. Epub 2018 Feb 1. Proteomics. 2018. PMID: 29280568 Free PMC article. Review.
-
Periostin and matrix stiffness combine to regulate myofibroblast differentiation and fibronectin synthesis during palatal healing.Matrix Biol. 2020 Dec;94:31-56. doi: 10.1016/j.matbio.2020.07.002. Epub 2020 Aug 7. Matrix Biol. 2020. PMID: 32777343 Free PMC article.
-
Caveolin-1 is a modulator of fibroblast activation and a potential biomarker for gastric cancer.Int J Biol Sci. 2015 Feb 15;11(4):370-9. doi: 10.7150/ijbs.10666. eCollection 2015. Int J Biol Sci. 2015. PMID: 25798057 Free PMC article.
References
-
- Tlsty T.D., et al. (2006). Tumor stroma and regulation of cancer development Annu. Rev. Pathol. 1 119–150 - PubMed
-
- Tuxhorn J.A., et al. (2002). Reactive stroma in human prostate cancer: induction of myofibroblast phenotype and extracellular matrix remodeling Clin. Cancer Res. 8 2912–2923 - PubMed
-
- Kalluri R., et al. (2006). Fibroblasts in cancer Nat. Rev. Cancer 6 392–401 - PubMed
Publication types
MeSH terms
Substances
Grants and funding
LinkOut - more resources
Full Text Sources
Research Materials

