. 2012 Aug;33(8):1487-93.
doi: 10.1093/carcin/bgs177. Epub 2012 May 18.

Single-CpG-resolution methylome analysis identifies clinicopathologically aggressive CpG island methylator phenotype clear cell renal cell carcinomas

Affiliations

Single-CpG-resolution methylome analysis identifies clinicopathologically aggressive CpG island methylator phenotype clear cell renal cell carcinomas

Eri Arai et al. Carcinogenesis. 2012 Aug.

Abstract

To clarify the significance of DNA methylation alterations during renal carcinogenesis, methylome analysis using single-CpG-resolution Infinium array was performed on 29 normal renal cortex tissue (C) samples, 107 non-cancerous renal cortex tissue (N) samples obtained from patients with clear cell renal cell carcinomas (RCCs) and 109 tumorous tissue (T) samples. DNA methylation levels at 4830 CpG sites were already altered in N samples compared with C samples. Unsupervised hierarchical clustering analysis based on DNA methylation levels at the 801 CpG sites, where DNA methylation alterations had occurred in N samples and were inherited by and strengthened in T samples, clustered clear cell RCCs into Cluster A (n = 90) and Cluster B (n = 14). Clinicopathologically aggressive tumors were accumulated in Cluster B, and the cancer-free and overall survival rates of patients in this cluster were significantly lower than those of patients in Cluster A. Clear cell RCCs in Cluster B were characterized by accumulation of DNA hypermethylation on CpG islands and considered to be CpG island methylator phenotype (CIMP)-positive cancers. DNA hypermethylation of the CpG sites on the FAM150A, GRM6, ZNF540, ZFP42, ZNF154, RIMS4, PCDHAC1, KHDRBS2, ASCL2, KCNQ1, PRAC, WNT3A, TRH, FAM78A, ZNF671, SLC13A5 and NKX6-2 genes became hallmarks of CIMP in RCCs. On the other hand, Cluster A was characterized by genome-wide DNA hypomethylation. These data indicated that DNA methylation alterations at precancerous stages may determine tumor aggressiveness and patient outcome. Accumulation of DNA hypermethylation on CpG islands and genome-wide DNA hypomethylation may each underlie distinct pathways of renal carcinogenesis.


Figures
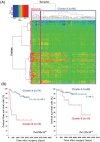
Fig. 1.
Fig. 1.
Unsupervised hierarchical clustering using DNA methylation levels (Δβ T–N) on the 801 probes in 104 patients with clear cell RCCs. The 801 probes satisfied all of the criteria (a), (b) and (c) in ‘DNA methylation alterations during renal carcinogenesis’ in Results and Table I. On the 801 probes, DNA methylation alterations occurred at the precancerous stages and were inherited by and strengthened in clear cell RCCs themselves. (A) 104 patients with clear cell RCCs were hierarchically clustered into Cluster A (n = 90) and Cluster B (n = 14). The DNA methylation levels (Δβ T–N) are shown in the color range maps. The cluster trees for patients and probes are shown at the top and left of the panel, respectively. (B) The cancer-free (P = 3.59 × 10⁻⁶) survival rates of Stage I–III patients in Cluster B were significantly lower (log-rank test) than those of patients in Cluster A. Overall (P = 1.32 × 10⁻²) survival rates of all patients in Cluster B were significantly lower (log-rank test) than those of patients in Cluster A.
Fig. 2.
Fig. 2.
(A) Distribution of DNA methylation levels (Δβ T–N) in all 26 454 probes in 104 clear cell RCCs belonging to Cluster A or B. The DNA methylation levels are shown in the color range maps. Clear cell RCCs belonging to Cluster A are skewed toward DNA hypomethylation (Δβ T–N < −0.1, cold color) relative to DNA hypermethylation (warm color). Clear cell RCCs belonging to Cluster B clearly showed accumulation of DNA hypermethylation (Δβ T–N > 0.1, warm color) relative to DNA hypomethylation (cold color). (B) The proportions of the probes showing the various degrees of DNA hypermethylation, when the tumor tissue (T) sample was compared with the corresponding non-cancerous renal cortex tissue (N) sample (Δβ T–N > 0.1, 0.2, 0.3, 0.4 or 0.5, warm color), to all probes, and the proportions of the probes showing the various degrees of DNA hypomethylation, when the T sample was compared with the corresponding N sample (Δβ T–N < −0.1, −0.2, −0.3, −0.4 or −0.5, cold color), to all probes in Clusters A and B. Bar, standard deviation. The probes showing DNA hypermethylation were markedly accumulated in Cluster B relative to Cluster A, regardless of the degree of DNA hypermethylation (Δβ T–N > 0.1, 0.2, 0.3, 0.4 or 0.5). The probes showing prominent DNA hypomethylation (Δβ T–N < −0.5) were slightly accumulated in Cluster B compared with Cluster A. These data indicated that clear cell RCCs belonging to Cluster B are mainly characterized by accumulation of DNA hypermethylation.

References

    1. Ljungberg B., et al. (2011). The epidemiology of renal cell carcinoma Eur. Urol. 60 615–621 - PubMed
    1. Arai E., et al. (2011). Genetic and epigenetic alterations during renal carcinogenesis Int. J. Clin. Exp. Pathol. 4 58–73 - PMC - PubMed
    1. Baldewijns M.M., et al. (2010). VHL and HIF signalling in renal cell carcinogenesis J. Pathol., 221 125–138 - PubMed
    1. Barrett I.P. (2010). Cancer genome analysis informatics Methods Mol. Biol. 628 75–102 - PubMed
    1. Zhang J., et al. (2011). International Cancer Genome Consortium Data Portal--a one-stop shop for cancer genomics data Database (Oxford) 2011, bar026 - PMC - PubMed

Publication types