. 2012 Jul 6;287(28):23932-47.
doi: 10.1074/jbc.M112.339457. Epub 2012 May 18.

Endoproteolytic cleavage of TUG protein regulates GLUT4 glucose transporter translocation

Affiliations

Endoproteolytic cleavage of TUG protein regulates GLUT4 glucose transporter translocation

Jonathan S Bogan et al. J Biol Chem. .

Abstract

To promote glucose uptake into fat and muscle cells, insulin causes the translocation of GLUT4 glucose transporters from intracellular vesicles to the cell surface. Previous data support a model in which TUG traps GLUT4-containing vesicles and tethers them intracellularly in unstimulated cells and in which insulin mobilizes this pool of vesicles by releasing this tether. Here we show that TUG undergoes site-specific endoproteolytic cleavage, which separates a GLUT4-binding, N-terminal region of TUG from a C-terminal region previously suggested to bind an intracellular anchor. Cleavage is accelerated by insulin stimulation in 3T3-L1 adipocytes and is highly dependent upon adipocyte differentiation. The N-terminal TUG cleavage product has properties of a novel 18-kDa ubiquitin-like modifier, which we call TUGUL. The C-terminal product is observed at the expected size of 42 kDa and also as a 54-kDa form that is released from membranes into the cytosol. In transfected cells, intact TUG links GLUT4 to PIST and also binds Golgin-160 through its C-terminal region. PIST is an effector of TC10α, a GTPase previously shown to transmit an insulin signal required for GLUT4 translocation, and we show using RNAi that TC10α is required for TUG proteolytic processing. Finally, we demonstrate that a cleavage-resistant form of TUG does not support highly insulin-responsive GLUT4 translocation or glucose uptake in 3T3-L1 adipocytes. Together with previous results, these data support a model whereby insulin stimulates TUG cleavage to liberate GLUT4 storage vesicles from the Golgi matrix, which promotes GLUT4 translocation to the cell surface and enhances glucose uptake.


Figures

FIGURE 1.
FIGURE 1.
Distinct N- and C-terminal TUG derivatives in 3T3-L1 adipocytes. A, TUG is a 550-residue protein containing three ubiquitin-like domains, denoted UBL1, UBL2, and UBL3/UBX. UBL2 ends with a diglycine sequence (GG), which defines a site for endoproteolytic cleavage to produce TUGUL, which may potentially act as a novel ubiquitin-like modifier. B, control 3T3-L1 adipocytes, cells containing a TUG shRNA, and “rescued” cells containing the shRNA and shRNA-resistant TUG (shRNA + TUG cells) were lysed using denaturing conditions. Lysates were immunoblotted using antibodies to the TUG N and C termini or to Hsc70 as a control, as indicated. The experiment was repeated twice with similar results.
FIGURE 2.
FIGURE 2.
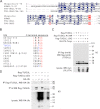
Mature TUGUL has characteristics of a ubiquitin-like protein modifier. A, sequence alignments of ubiquitin, SUMO-1, and the two ubiquitin-like regions within the TUG N terminus, UBL1, and UBL2. Conserved residues are in blue. Terminal diglycine sequences of ubiquitin, SUMO-1, and TUGUL are highlighted in red. Additionally, TUG Lys-134 and ubiquitin Lys-48 are also highlighted in red. B, alignments of the C-terminal residues from several ubiquitin-like proteins and comparison with C-terminal residues from TUGUL (residues 159–164 of intact TUG). B is adapted from Ref. . C, FLAG-tagged TUGUL, TUGUL K134R, or TUGUL ΔGG (which lacks the terminal diglycine sequence) were coexpressed with GLUT4 by transient transfection of 293T cells. Cells were lysed in boiling 1% SDS, and then lysates were diluted with Triton X-100, and proteins were immunoprecipitated (IP) and immunoblotted (WB) as indicated. D, cells were transfected with FLAG-tagged TUGUL or TUGUL ΔGG and HA-tagged ubiquitin (Ub). After denaturing lysis, proteins were immunoprecipitated and immunoblotted as indicated. Experiments were repeated at least twice, with similar results.
FIGURE 3.
FIGURE 3.
Production of TUG derivatives by site-specific endoproteolytic cleavage. A, cells were treated or not with 10 μm MG-132 for 40 min and then with insulin, as indicated. After denaturing lysis, immunoblots were done as indicated. Controls show phosphorylation of the insulin receptor (IRβ p-Y) and equal loading (Hsc70 and GLUT4). B, control and shRNA cells were treated with insulin, lysed in denaturing conditions, and immunoblotted as indicated. IRβ, insulin receptor β-chain. C, cells were pulse-labeled with 35S-labeled Cys and Met, chased in non-radioactive amino acids and cycloheximide and in the presence or absence of insulin, and lysed at the indicated times using denaturing conditions. Immunoprecipitations were done with the TUG C terminus antibody, and eluted material was analyzed by SDS-PAGE and phosphorimaging. IgG was visualized by Coomassie staining (bracket) and probably altered migration of the 54-kDa C-terminal product observed in other experiments (asterisk). D, control cells, shRNA cells, and shRNA cells containing shRNA-resistant wild type or mutated TUG were treated with insulin as indicated. After denaturing lysis, immunoblots were done as indicated. Experiments were repeated at least twice with similar results.
FIGURE 4.
FIGURE 4.
TUG processing occurs in 3T3-L1 adipocytes but not in non-adipocyte cells. A, 293T cells and 3T3-L1 adipocytes were lysed using denaturing conditions, and immunoblots (WB) were done using the TUG C terminus antibody. Duplicate samples are shown. B, 293T cells and 3T3-L1 cells at the indicated stages of adipocyte differentiation were lysed using denaturing conditions and immunoblotted using the TUG C terminus antibody. Immunoblots were quantified, and the ratio of band intensities at 54 and 60 kDa is plotted. Error bars, S.E.; n = 2 for 293T cells and day 0 3T3-L1 cells; n = 6 for day 5 and day 10 3T3-L1 cells.
FIGURE 5.
FIGURE 5.
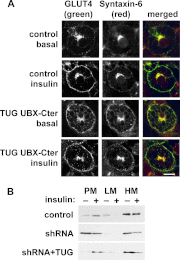
TUG processing occurs on membranes containing GLUT4 storage vesicles. A, 3T3-L1 adipocytes were treated with insulin as indicated, and then membrane and cytosol fractions were isolated and immunoblotted to detect the TUG C and N termini. B, PM, LM, and HM fractions were isolated from basal and insulin-treated control 3T3-L1 adipocytes and from cells expressing dominant negative TUG UBX-Cter. All cells contained a Myc-tagged GLUT4 reporter. Fractions were immunoblotted as indicated. Experiments were repeated at least twice with similar results.
FIGURE 6.
FIGURE 6.
TUG disruption mobilizes syntaxin-6 to the plasma membrane. A, basal and insulin-treated control and UBX-Cter-containing 3T3-L1 adipocytes were imaged using confocal microscopy. GLUT4 was detected by a GFP tag, and syntaxin-6 was detected by immunostaining. Scale bar, 10 μm. B, control, shRNA, and shRNA + TUG 3T3-L1 adipocytes were treated with insulin, subjected to subcellular fractionation, and immunoblotted as indicated to detect syntaxin-6. Experiments were repeated at least twice with similar results.
FIGURE 7.
FIGURE 7.
Evidence that TUG cleavage separates GLUT4 from the Golgi matrix and requires TC10α. A, tagged forms of GLUT4, PIST, and TUG were transfected in 293T cells as indicated. GLUT4 was immunoprecipitated, and bound proteins were analyzed by SDS-PAGE and immunoblotting as indicated. B, PIST was translated in vitro in the presence of 35S-labeled Cys and Met and was incubated with recombinant GST-TUG or with GST alone. Bound proteins were analyzed by SDS-PAGE and autoradiography. C, basal and insulin-stimulated 3T3-L1 adipocytes stably expressing HA-PIST and GLUT4-GFP were imaged by confocal microscopy. Scale bar, 10 μm. D, GFP-tagged Golgin-160 and protein A (ZZ)-tagged TUG were transfected in 293T cells, and TUG was purified by binding to immobilized IgG. Eluates and lysates were immunoblotted as indicated. E, 3T3-L1 adipocytes were electroporated with synthetic siRNAs directed to TC10α or luciferase (as a control) or mock-electroporated. Cells were treated with or without insulin and then lysed using denaturing conditions and immunoblotted as indicated. All experiments were repeated at least twice with similar results.
FIGURE 8.
FIGURE 8.
Quantification of TUG abundance in 3T3-L1 adipocytes. A, serial dilutions of recombinant GST-TUG-UBX-Cter and a bovine serum albumin standard were subjected to SDS-PAGE and staining with GelCode Coomassie. Densitometry showed that 10 μl of a 1:20 dilution of the recombinant TUG protein contained 20 ng, or about 2.5 × 10¹¹ molecules (based on the molecular mass of GST-TUG-UBX-Cter, 47 kDa). B, immunoblots of a whole cell lysate from 3T3-L1 adipocytes and of recombinant GST-TUG-UBX-Cter were performed using an antibody directed to the C terminus of TUG. Densitometry showed that ∼1.25 × 10¹⁰ molecules of intact TUG (60 kDa) were present in 6 × 10⁴ cells, so that ∼200,000 molecules of TUG are present in each 3T3-L1 adipocyte.
FIGURE 9.
FIGURE 9.
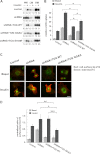
TUG cleavage is required for regulated GLUT4 targeting in 3T3-L1 adipocytes. A, PM, LM, and HM fractions were isolated from basal and insulin-treated cells containing TUG shRNA and shRNA-resistant proteins, as indicated, and were immunoblotted for GLUT4. Band intensities are indicated and were normalized to GLUT4 in the HM fraction of unstimulated cells (set to 10) in each case. Similar results were obtained in at least two independent experiments for each cell line. B, basal and insulin-stimulated 2-deoxyglucose (2-DG) uptake was measured in the indicated cells and is plotted relative to insulin-stimulated control cells. Results shown are mean ± S.E. (error bars); n = 3; *, p < 0.05. C and D, targeting of newly synthesized GLUT4 in the indicated cells was measured 18–20 h after electroporation of a dual Myc- and GFP-tagged GLUT4 reporter. C, epifluorescence microscopy was used to image cell surface and total amounts of the reporter. D, images were quantified, and ratios were calculated and plotted relative to insulin-stimulated control cells. Results shown are mean ± S.E.; n = 16 basal and 27–30 insulin-stimulated cells in each group; *, p < 0.05; **, p < 0.01; ***, p < 0.001.

Similar articles

Cited by

References

    1. Rubin B. R., Bogan J. S. (2009) Intracellular retention and insulin-stimulated mobilization of GLUT4 glucose transporters. Vitam. Horm. 80, 155–192 - PubMed
    1. Huang S., Czech M. P. (2007) The GLUT4 glucose transporter. Cell Metab. 5, 237–252 - PubMed
    1. Bogan J. S. (2012) Regulation of glucose transporter translocation in health and diabetes. Annu. Rev. Biochem. 81, 507–532 - PubMed
    1. Bogan J. S., Kandror K. V. (2010) Biogenesis and regulation of insulin-responsive vesicles containing GLUT4. Curr. Opin. Cell Biol. 22, 506–512 - PMC - PubMed
    1. Kandror K. V., Pilch P. F. (2011) The sugar is sIRVed. Sorting Glut4 and its fellow travelers. Traffic 12, 665–671 - PubMed

Publication types

MeSH terms