

Extremely low-coverage sequencing and imputation increases power for genome-wide association studies
- PMID: 22610117
- PMCID: PMC3400344
- DOI: 10.1038/ng.2283
Extremely low-coverage sequencing and imputation increases power for genome-wide association studies
Abstract
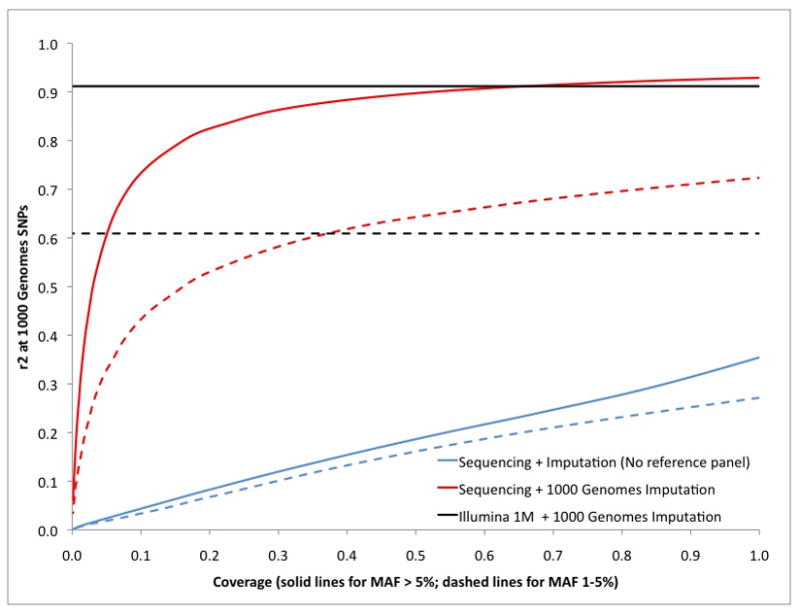
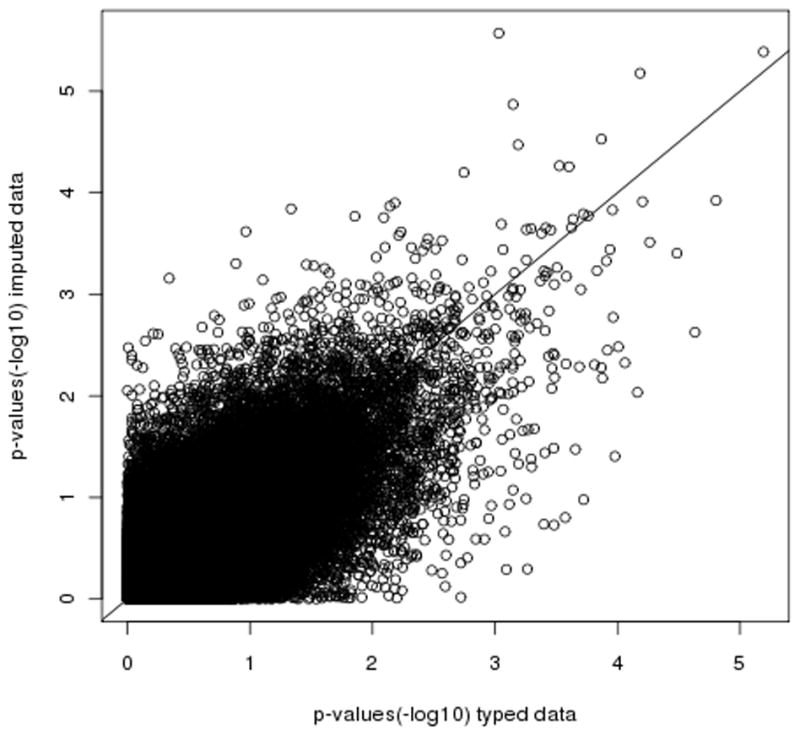
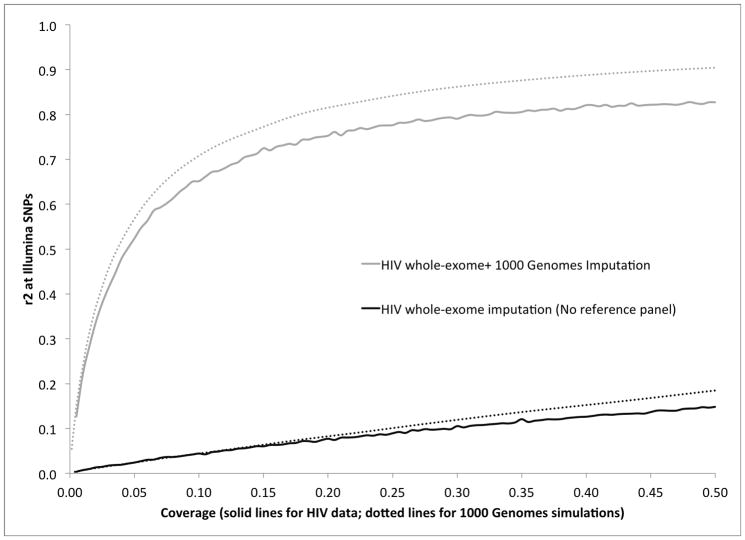
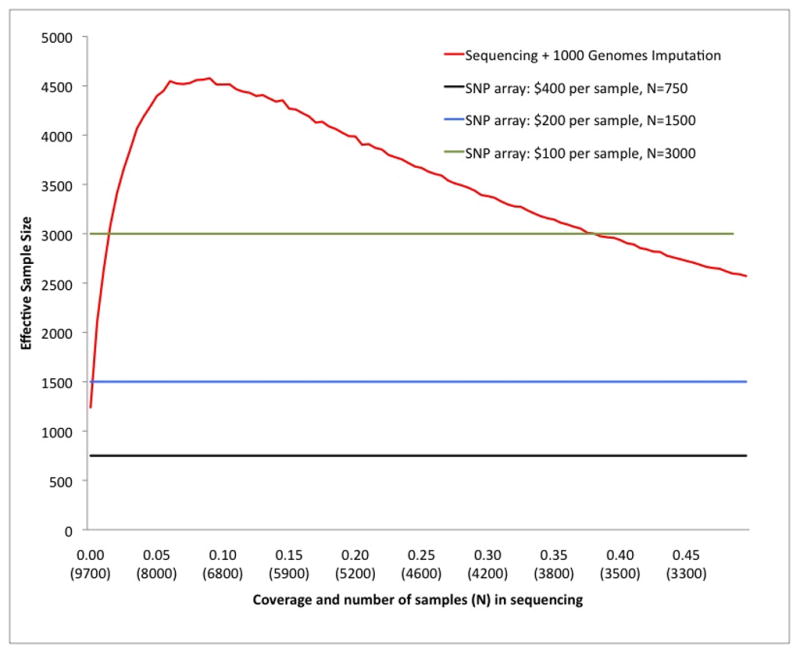
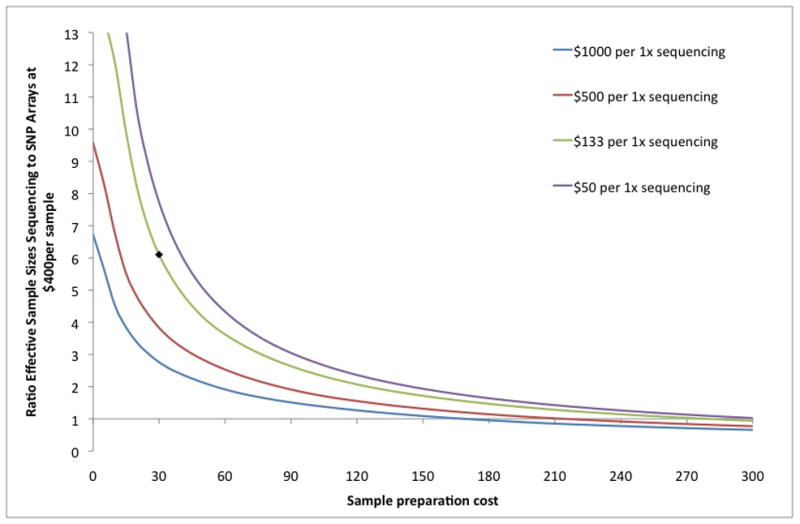
Genome-wide association studies (GWAS) have proven to be a powerful method to identify common genetic variants contributing to susceptibility to common diseases. Here, we show that extremely low-coverage sequencing (0.1-0.5×) captures almost as much of the common (>5%) and low-frequency (1-5%) variation across the genome as SNP arrays. As an empirical demonstration, we show that genome-wide SNP genotypes can be inferred at a mean r(2) of 0.71 using off-target data (0.24× average coverage) in a whole-exome study of 909 samples. Using both simulated and real exome-sequencing data sets, we show that association statistics obtained using extremely low-coverage sequencing data attain similar P values at known associated variants as data from genotyping arrays, without an excess of false positives. Within the context of reductions in sample preparation and sequencing costs, funds invested in extremely low-coverage sequencing can yield several times the effective sample size of GWAS based on SNP array data and a commensurate increase in statistical power.
Figures
References
Publication types
MeSH terms
Grants and funding
- AI069452/AI/NIAID NIH HHS/United States
- UM1 AI069556/AI/NIAID NIH HHS/United States
- U01 AI069511/AI/NIAID NIH HHS/United States
- AI069450/AI/NIAID NIH HHS/United States
- U01 AI069477/AI/NIAID NIH HHS/United States
- U01 AI069502/AI/NIAID NIH HHS/United States
- U01 AI069513/AI/NIAID NIH HHS/United States
- AI68634/AI/NIAID NIH HHS/United States
- AI69467/AI/NIAID NIH HHS/United States
- UM1 AI069423/AI/NIAID NIH HHS/United States
- AI069415/AI/NIAID NIH HHS/United States
- U01 AI069474/AI/NIAID NIH HHS/United States
- AI069465/AI/NIAID NIH HHS/United States
- U01 AI069434/AI/NIAID NIH HHS/United States
- AI069556/AI/NIAID NIH HHS/United States
- UM1 AI069501/AI/NIAID NIH HHS/United States
- UM1 AI069472/AI/NIAID NIH HHS/United States
- U01 AI069467/AI/NIAID NIH HHS/United States
- U01 AI069423/AI/NIAID NIH HHS/United States
- UM1 AI069513/AI/NIAID NIH HHS/United States
- R01 MH089208/MH/NIMH NIH HHS/United States
- R01 MH095034/MH/NIMH NIH HHS/United States
- AI069419/AI/NIAID NIH HHS/United States
- AI069511/AI/NIAID NIH HHS/United States
- AI46370/AI/NIAID NIH HHS/United States
- AI077505/AI/NIAID NIH HHS/United States
- U01 AI027661/AI/NIAID NIH HHS/United States
- UM1 AI069424/AI/NIAID NIH HHS/United States
- R01 AI077505/AI/NIAID NIH HHS/United States
- RC2 MH089905/MH/NIMH NIH HHS/United States
- U01 AI069465/AI/NIAID NIH HHS/United States
- T32 ES007142/ES/NIEHS NIH HHS/United States
- P30 DK043351/DK/NIDDK NIH HHS/United States
- UM1 AI069434/AI/NIAID NIH HHS/United States
- UM1 AI069432/AI/NIAID NIH HHS/United States
- AI069501/AI/NIAID NIH HHS/United States
- R01 MH089004/MH/NIMH NIH HHS/United States
- AI069532/AI/NIAID NIH HHS/United States
- AI069474/AI/NIAID NIH HHS/United States
- AI069434/AI/NIAID NIH HHS/United States
- 5RC2MH089905/MH/NIMH NIH HHS/United States
- UM1 AI069495/AI/NIAID NIH HHS/United States
- U01 AI069484/AI/NIAID NIH HHS/United States
- UM1 AI069471/AI/NIAID NIH HHS/United States
- U01 AI069556/AI/NIAID NIH HHS/United States
- AI069513/AI/NIAID NIH HHS/United States
- AI069502/AI/NIAID NIH HHS/United States
- TL1 RR024978/RR/NCRR NIH HHS/United States
- R01 HG006399/HG/NHGRI NIH HHS/United States
- UM1 AI069428/AI/NIAID NIH HHS/United States
- U01 AI069532/AI/NIAID NIH HHS/United States
- U01 AI034835/AI/NIAID NIH HHS/United States
- AI069423/AI/NIAID NIH HHS/United States
- AI30914/AI/NIAID NIH HHS/United States
- U01 AI069428/AI/NIAID NIH HHS/United States
- KL2 RR024977/RR/NCRR NIH HHS/United States
- UM1 AI069415/AI/NIAID NIH HHS/United States
- AI27661/AI/NIAID NIH HHS/United States
- UM1 AI069484/AI/NIAID NIH HHS/United States
- AI069428/AI/NIAID NIH HHS/United States
- AI34853/AI/NIAID NIH HHS/United States
- UM1 AI068634/AI/NIAID NIH HHS/United States
- U01 AI069501/AI/NIAID NIH HHS/United States
- AI069495/AI/NIAID NIH HHS/United States
- UM1 AI069477/AI/NIAID NIH HHS/United States
- U01 AI069432/AI/NIAID NIH HHS/United States
- P-30-AI060354/AI/NIAID NIH HHS/United States
- AI069484/AI/NIAID NIH HHS/United States
- AI068636/AI/NIAID NIH HHS/United States
- U01 AI069450/AI/NIAID NIH HHS/United States
- U01 AI046370/AI/NIAID NIH HHS/United States
- U01 AI068636/AI/NIAID NIH HHS/United States
- R01 MH089025/MH/NIMH NIH HHS/United States
- RR024975/RR/NCRR NIH HHS/United States
- UM1 AI069474/AI/NIAID NIH HHS/United States
- R01MH089208/MH/NIMH NIH HHS/United States
- U01 AI034853/AI/NIAID NIH HHS/United States
- R37 AI028568/AI/NIAID NIH HHS/United States
- UM1 AI069452/AI/NIAID NIH HHS/United States
- AI069424/AI/NIAID NIH HHS/United States
- U01 AI069415/AI/NIAID NIH HHS/United States
- U01 AI069495/AI/NIAID NIH HHS/United States
- UM1 AI069502/AI/NIAID NIH HHS/United States
- U01 AI025859/AI/NIAID NIH HHS/United States
- UM1 AI069450/AI/NIAID NIH HHS/United States
- AI34835/AI/NIAID NIH HHS/United States
- UM1 AI069532/AI/NIAID NIH HHS/United States
- R01 MH084676/MH/NIMH NIH HHS/United States
- U01 AI069424/AI/NIAID NIH HHS/United States
- UM1 AI069465/AI/NIAID NIH HHS/United States
- U01 DE017018/DE/NIDCR NIH HHS/United States
- AL32782/PHS HHS/United States
- U01 AI032782/AI/NIAID NIH HHS/United States
- UL1 RR024975/RR/NCRR NIH HHS/United States
- AI069472/AI/NIAID NIH HHS/United States
- UM1 AI069419/AI/NIAID NIH HHS/United States
- AI28568/AI/NIAID NIH HHS/United States
- AI069432/AI/NIAID NIH HHS/United States
- R01 AI028568/AI/NIAID NIH HHS/United States
- P30 AI060354/AI/NIAID NIH HHS/United States
- U01 AI069419/AI/NIAID NIH HHS/United States
- R01 AI030914/AI/NIAID NIH HHS/United States
- AI25859/AI/NIAID NIH HHS/United States
- UM1 AI069511/AI/NIAID NIH HHS/United States
- U01 AI069452/AI/NIAID NIH HHS/United States
- UM1 AI069467/AI/NIAID NIH HHS/United States
- AI38844/AI/NIAID NIH HHS/United States
- AI069477/AI/NIAID NIH HHS/United States
- U01 AI038844/AI/NIAID NIH HHS/United States
- AI069471/AI/NIAID NIH HHS/United States
- U01 AI069471/AI/NIAID NIH HHS/United States
- U01 AI069472/AI/NIAID NIH HHS/United States
- U01 AI068634/AI/NIAID NIH HHS/United States
- R01 MH089482/MH/NIMH NIH HHS/United States
- UM1 AI068636/AI/NIAID NIH HHS/United States
LinkOut - more resources
Full Text Sources
Other Literature Sources
Molecular Biology Databases
Research Materials
