. 2013 Nov;34(11):2747-66.
doi: 10.1002/hbm.22099. Epub 2012 May 19.

Investigating the prevalence of complex fiber configurations in white matter tissue with diffusion magnetic resonance imaging

Affiliations

Investigating the prevalence of complex fiber configurations in white matter tissue with diffusion magnetic resonance imaging

Ben Jeurissen et al. Hum Brain Mapp. 2013 Nov.

Abstract

It has long been recognized that the diffusion tensor model is inappropriate to characterize complex fiber architecture, causing tensor-derived measures such as the primary eigenvector and fractional anisotropy to be unreliable or misleading in these regions. There is however still debate about the impact of this problem in practice. A recent study using a Bayesian automatic relevance detection (ARD) multicompartment model suggested that a third of white matter (WM) voxels contain crossing fibers, a value that, whilst already significant, is likely to be an underestimate. The aim of this study is to provide more robust estimates of the proportion of affected voxels, the number of fiber orientations within each WM voxel, and the impact on tensor-derived analyses, using large, high-quality diffusion-weighted data sets, with reconstruction parameters optimized specifically for this task. Two reconstruction algorithms were used: constrained spherical deconvolution (CSD), and the ARD method used in the previous study. We estimate the proportion of WM voxels containing crossing fibers to be ~90% (using CSD) and 63% (using ARD). Both these values are much higher than previously reported, strongly suggesting that the diffusion tensor model is inadequate in the vast majority of WM regions. This has serious implications for downstream processing applications that depend on this model, particularly tractography, and the interpretation of anisotropy and radial/axial diffusivity measures.

Keywords: bedpostx; constrained spherical deconvolution; crossing fibers; high-angular resolution diffusion imaging; partial volume effect; residual bootstrap; white matter.


Figures

Figure 1
Figure 1
Extraction of the CSD FOD fiber orientations: three orientation example. (a) Points uniformly distributed on the half‐sphere (red dots) used as starting points for the maximization of the FOD amplitude (green); (b) the corresponding FOD maxima (note that many overlap); (c) the unique FOD maxima (note that three of the spurious maxima have very low amplitude and are clustered near the origin); (d) FOD maxima with amplitude higher than FOD threshold (gray sphere). [Color figure can be viewed in the online issue, which is available at http://wileyonlinelibrary.com.]
Figure 2
Figure 2
Computation of the WM mask: T1‐weighted image (a) and the corresponding WM/GM/CSF segmentation (b). WM probability is colored red, GM probability green, and CSF probability blue. The WM probability map is thresholded at 95% to create a binary WM map (c). MD outliers resulting from partial volume effect at the interface between WM and CSF are colored red. Coregistered T1‐weighted image (gray) overlayed with FA image (pink) (d). [Color figure can be viewed in the online issue, which is available at http://wileyonlinelibrary.com.]
Figure 3
Figure 3
Multifiber simulations (specificity): the relative number of false positives as a function of the CSD FOD threshold (a) and the bedpostx ARD weight (b) for one‐fiber (red curve) and two‐fiber (green curve) voxels. [Color figure can be viewed in the online issue, which is available at http://wileyonlinelibrary.com.]
Figure 4
Figure 4
Multifiber simulations (minimum resolvable angle). The average number of detected fiber orientations in two‐fiber and three‐fiber voxels as a function of angle. The different colors represent the different weights of the constituent DWI signals. [Color figure can be viewed in the online issue, which is available at http://wileyonlinelibrary.com.]
Figure 5
Figure 5
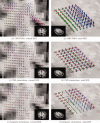
Examples of the extracted fiber orientations in two regions containing crossing fibers. The CSD FODs and the extracted fiber orientations are shown in (a)–(b) and (c)–(d), respectively. The bedpostx fiber orientations are shown in (e)–(f). [Color figure can be viewed in the online issue, which is available at http://wileyonlinelibrary.com.]
Figure 6
Figure 6
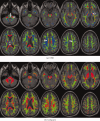
Number of fiber orientations per voxel (red: 1; green: 2; blue: ≥3) for subject 1 estimated with CSD (a) and bedpostx (b). The numbered arrows in (a) correspond to the following structures: (1) corpus callosum (CC); (2) middle cerebellar peduncle; (3) posterior limb of the internal capsule; (4) pons/motor pathways; (5) superior longitudinal fasciculus (SLF)/corona radiata; (6) corona radiata/SLF/CC. [Color figure can be viewed in the online issue, which is available at http://wileyonlinelibrary.com.]
Figure 7
Figure 7
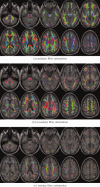
The primary (a), secondary (b), and tertiary (c) fiber orientations (in order of decreasing FOD amplitude) extracted for subject 1 with CSD, shown as RGB color maps (red, left–right; green, anterior–posterior; blue, inferior–superior). [Color figure can be viewed in the online issue, which is available at http://wileyonlinelibrary.com.]
Figure 8
Figure 8
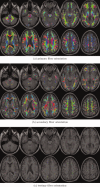
The primary (a), secondary (b), and tertiary (c) fiber orientations (in order of decreasing volume fraction) extracted for subject 1 with bedpostx, shown as RGB color maps (red, left–right; green, anterior–posterior; blue, inferior–superior). [Color figure can be viewed in the online issue, which is available at http://wileyonlinelibrary.com.]
Figure 9
Figure 9
Consistency of the orientations across residual bootstrap realizations, for the same region as Figure 5d. To aid visualization, only 30 realizations are shown. [Color figure can be viewed in the online issue, which is available at http://wileyonlinelibrary.com.]
Figure 10
Figure 10
Tractography in a three‐fiber region reveals global consistency of three‐fiber orientations. Seed region is indicated by a magenta arrowhead. Commissural fibers are colored red, association fibers green, and projection fibers blue. All three pathways identified using CSD tracking are anatomically plausible. [Color figure can be viewed in the online issue, which is available at http://wileyonlinelibrary.com.]
Figure 11
Figure 11
Percentages of single‐ and multifiber voxels throughout the WM for different CSD FOD thresholds (a)–(b) and bedpostx volume fraction thresholds (c)–(d) for both subjects. The actual threshold values used in this study are shown as a dashed line. [Color figure can be viewed in the online issue, which is available at http://wileyonlinelibrary.com.]
Figure 12
Figure 12
Histogram of the average interfiber angle for all voxels with ≥2 fiber populations for both CSD (a) and bedpostx (b). [Color figure can be viewed in the online issue, which is available at http://wileyonlinelibrary.com.]
Figure 13
Figure 13
The angle between the fiber orientation estimated by the primary eigenvector from DTI and the nearest CSD fiber orientation (a) displayed overlaid on an anatomical reference image, (b) as a histogram over all WM voxels, and (c) as the corresponding cumulative histogram. [Color figure can be viewed in the online issue, which is available at http://wileyonlinelibrary.com.]
Figure 14
Figure 14
The nondominant volume fraction measured by CSD, (a) displayed overlaid on an anatomical reference image, (b) as a histogram over all WM voxels, and (c) as the corresponding cumulative histogram. [Color figure can be viewed in the online issue, which is available at http://wileyonlinelibrary.com.]

References

    1. Alexander AL, Hasan KM, Lazar M, Tsuruda JS, Parker DL (2001): Analysis of partial volume effects in diffusion‐tensor MRI. Magn Reson Med 45:770–780. - PubMed
    1. Alexander DC (2006): Multiple‐fiber reconstruction algorithms for diffusion MRI. Ann NY Acad Sci 1064:113–133. - PubMed
    1. Alexander DC, Barker GJ, Arridge SR (2002): Detection and modeling of non‐Gaussian apparent diffusion coefficient profiles in human brain data. Magn Reson Med 48:331–340. - PubMed
    1. Ashburner J, Friston KJ (2005): Unified segmentation. NeuroImage 26:839–851. - PubMed
    1. Assaf Y, Pasternak O (2008): Diffusion tensor imaging (DTI)‐based white matter mapping in brain research: A review. J Mol Neurosci 34:51–61. - PubMed

Publication types