. 2012 Aug;26(8):3453-63.
doi: 10.1096/fj.12-205781. Epub 2012 May 18.

The clock gene, brain and muscle Arnt-like 1, regulates adipogenesis via Wnt signaling pathway

Affiliations

The clock gene, brain and muscle Arnt-like 1, regulates adipogenesis via Wnt signaling pathway

Bingyan Guo et al. FASEB J. 2012 Aug.

Abstract

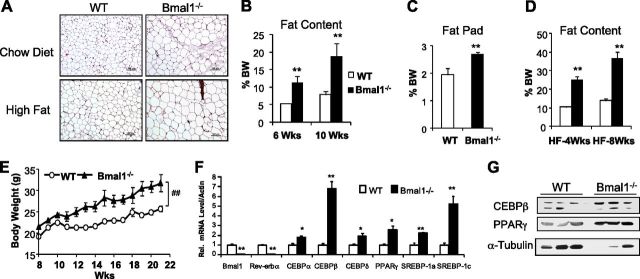
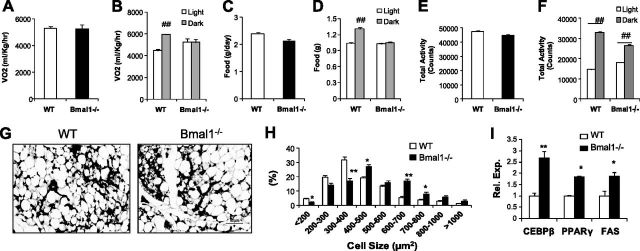
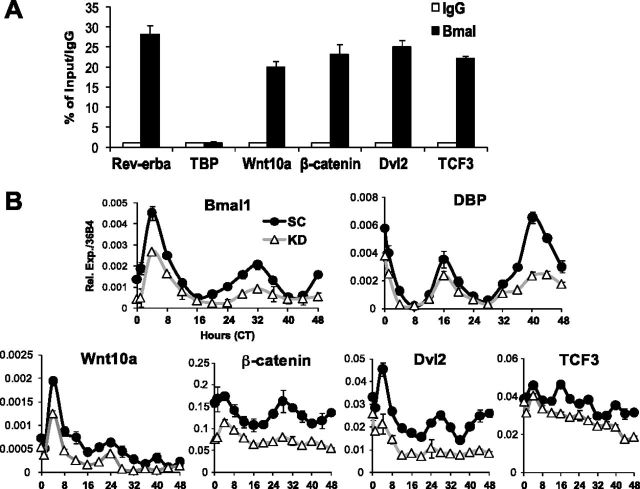
Circadian clocks in adipose tissue are known to regulate adipocyte biology. Although circadian dysregulation is associated with development of obesity, the underlying mechanism has not been established. Here we report that disruption of the clock gene, brain and muscle Arnt-like 1 (Bmal1), in mice led to increased adipogenesis, adipocyte hypertrophy, and obesity, compared to wild-type (WT) mice. This is due to its cell-autonomous effect, as Bmal1 deficiency in embryonic fibroblasts, as well as stable shRNA knockdown (KD) in 3T3-L1 preadipocyte and C3H10T1/2 mesenchymal stem cells, promoted adipogenic differentiation. We demonstrate that attenuation of Bmal1 function resulted in down-regulation of genes in the canonical Wnt pathway, known to suppress adipogenesis. Promoters of these genes (Wnt10a, β-catenin, Dishevelled2, TCF3) displayed Bmal1 occupancy, indicating direct circadian regulation by Bmal1. As a result, Wnt signaling activity was attenuated by Bmal1 KD and augmented by its overexpression. Furthermore, stabilizing β-catenin through Wnt ligand or GSK-3β inhibition achieved partial restoration of blunted Wnt activity and suppression of increased adipogenesis induced by Bmal1 KD. Taken together, our study demonstrates that Bmal1 is a critical negative regulator of adipocyte development through transcriptional control of components of the canonical Wnt signaling cascade, and provides a mechanistic link between circadian disruption and obesity.


Conflict of interest statement

The authors thank The Methodist Hospital Research Institute (TMHRI) for funding support and the Center for Diabetes Research for technical assistance.

Figures

Figure 1.
Figure 1.
Bmal1−/− mice develop obesity when fed regular chow or a high-fat diet. A) Hematoxylin and eosin staining of white adipose tissue at 10 wk of age. B, C) Total body fat content of mice fed regular chow, as determined by NMR (B) and direct measurement of perigonadal white fat pad weight (C). D) Total body fat content analysis of mice fed a high-fat diet. E) Growth curve of mice fed a high-fat diet (n=7–10/group). ##P < 0.05; 1-way ANOVA. F, G) Gene expression level of adipogenic factors in white adipose tissue, as determined by quantitative RT-PCR (F; n=5) and Western blot analysis (G; n=3). *P < 0.05, **P < 0.01 vs. WT.
Figure 2.
Figure 2.
CLAMS analysis and adipose development in 7-d-old neonates. A–F) Total (A, C, E) and light vs. dark cycle (B, D, F) oxygen consumption (A, B), food intake (C, D) and activity level (E, F) in WT and Bmal1−/− mice fed a chow diet (n=5–6/group). ##P < 0.01 vs. light cycle. G–I) Histology (G), quantification of adipocyte cell size distribution (H), and gene expression analysis (I) of subcutaneous white adipose tissue (n=4–5) in 7-d-old neonates. Adipocyte cell size was quantified from 3 representative fields (×200) from each mouse. *P < 0.05, **P < 0.01 vs. WT.
Figure 3.
Figure 3.
Stable Bmal1 KD promoted adipogenesis during early differentiation of 3T3-L1 preadipocytes. A) mRNA level of Bmal1 and Rev-erbα in SC and KD (shBmal1) cells, as determined by quantitative RT-PCR (n=3). B) Western blot analysis of Bmal1 protein. C) Oil-red-O staining at d 3 of differentiation. D) Gene expression analysis during differentiation, as determined by RT-qPCR (n=3). *P < 0.05, **P < 0.01 vs. SC.
Figure 4.
Figure 4.
Stable Bmal1 KD promoted adipogenic differentiation of 10T1/2 cells. A, B) Oil-red-O staining of whole plate (A) and representative microscopic images (×100; B) at d 8 of adipogenic differentiation.C, D) Immunoblot analysis of Bmal1 (C) and adipogenic factors (D) during differentiation. E) Quantitative RT-PCR analysis of adipogenic factors and circadian genes during differentiation (n=3). *P < 0.05, **P < 0.01 vs. SC; Student's t test.
Figure 5.
Figure 5.
Enhanced adipogenic differentiation in MEF cells of Bmal1−/− mice. A) Oil-red-O staining of MEF cells (top panels) and quantification (bottom panels). B) Oil-red-O staining (top panels) and phase-contrast images (bottom panels). C) Quantitative PCR analysis of adipogenic marker gene expression at d 0, 3, and 6. D) Bmal1 protein level, as determined by immunoblot analysis (n=3). HET, heterozygote; KO, knockout (homozygote). *P < 0.05, **P < 0.01 vs WT.
Figure 6.
Figure 6.
Inhibition of Wnt signaling pathway by attenuation of Bmal1 function. A, B) Gene expression analysis by quantitative RT-PCR in 10T1/2 cells (A) and Bmal1−/− MEF cells (B) at d 0–6; n = 3. HET, heterozygote; KO, knockout (homozygote). *P < 0.05, **P < 0.01; Student's t test. C, D) Immunoblot analysis of β-catenin protein level in Cyt fraction and total lysate in WT and Bmal1−/− MEF cells (C) and Bmal1-KD and Bmal1-overexpressing (cDNA) 10T1/2 cells with and without Wnt3a treatment (D). Right panels show quantification of cytosolic to total lysate ratio (n=3). *P < 0.05, **P < 0.01; ##P < 0.01. E) TOPFlash luciferase activity with and without Wnt3a in Bmal1-KD, Bmal1-overexpressing, and control 10T1/2 cells. Values are expressed as TOPFlash reporter activity normalized to Renilla readings after FOPFlash subtraction (n=4). **P < 0.01; ##P < 0.01.
Figure 7.
Figure 7.
Components of Wnt pathway are direct target genes of Bmal1. A) ChIP assay of Bmal1 occupation in promoters containing E-boxes. Rev-erbα primers are used as positive controls and TBP primers as negative controls for the analysis. Data are expressed as percentage of input level normalized to IgG control (n=3). B) Circadian expression patterns of Bmal1 target genes in Wnt pathway induced by serum shock in 10T1/2 cells, with CT 0 as the first time point after serum shock (n=3/time point).
Figure 8.
Figure 8.
Partial rescue of adipogenesis by Wnt3a and GSK-3β inhibitor in SC and Bmal1-KD 10T1/2 cells. A, B) Representative images of Oil-red-O staining (A) and phase contrast (B) of adipogenic differentiation at d 9, with and without Wnt3a treatment. C) RT-qPCR analysis of adipogenic markers at d 6 of differentiation, with and without Wnt3a treatment (first 3 d). D) Oil-red-O staining and corresponding phase-contrast images (left 2 panels) and LipidTOX Green neutral lipid staining at ×10 and ×20 view (right 2 panels) at d 9 of differentiation after GSK-3β inhibitor SB-216763 treatment. E) Expression of adipogenic markers at d 6 of differentiation after SB-216763 treatment (first 2 d). n = 3/group. **P < 0.05; Student's t test.

References

    1. Bass J., Takahashi J. S.. Circadian integration of metabolism and energetics. Science (New York) , 1349–1354 - PMC - PubMed
    1. Green C. B., Takahashi J. S., Bass J. (2008) The meter of metabolism. Cell , 728–742 - PMC - PubMed
    1. Panda S., Antoch M. P., Miller B. H., Su A. I., Schook A. B., Straume M., Schultz P. G., Kay S. A., Takahashi J. S., Hogenesch J. B. (2002) Coordinated transcription of key pathways in the mouse by the circadian clock. Cell , 307–320 - PubMed
    1. Otway D. T., Frost G., Johnston J. D. (2009) Circadian rhythmicity in murine pre-adipocyte and adipocyte cells. Chronobiol. Int. , 1340–1354 - PubMed
    1. Wu X., Zvonic S., Floyd Z. E., Kilroy G., Goh B. C., Hernandez T. L., Eckel R. H., Mynatt R. L., Gimble J. M. (2007) Induction of circadian gene expression in human subcutaneous adipose-derived stem cells. Obesity (Silver Spring, Md.) , 2560–2570 - PubMed

Publication types

Substances