. 2012 Jun 15;188(12):6093-108.
doi: 10.4049/jimmunol.1103037. Epub 2012 May 18.

A p53 axis regulates B cell receptor-triggered, innate immune system-driven B cell clonal expansion

Affiliations

A p53 axis regulates B cell receptor-triggered, innate immune system-driven B cell clonal expansion

Hyunjoo Lee et al. J Immunol. .

Abstract

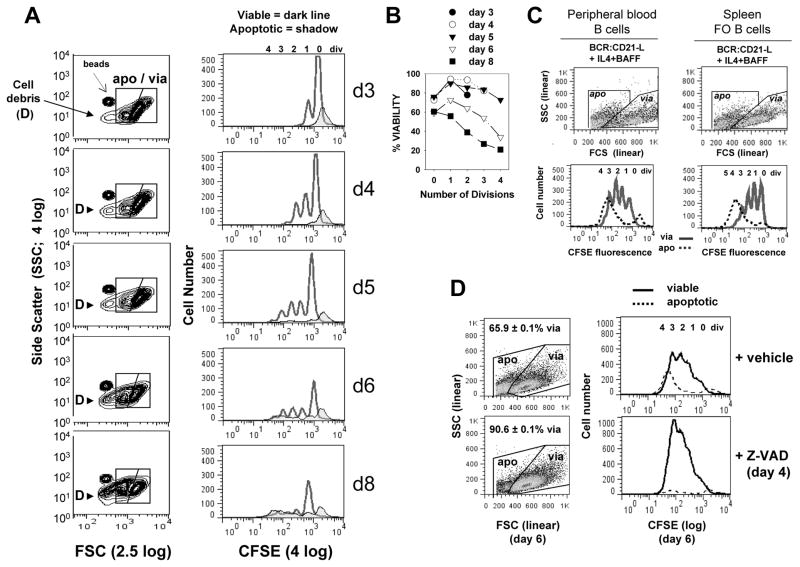
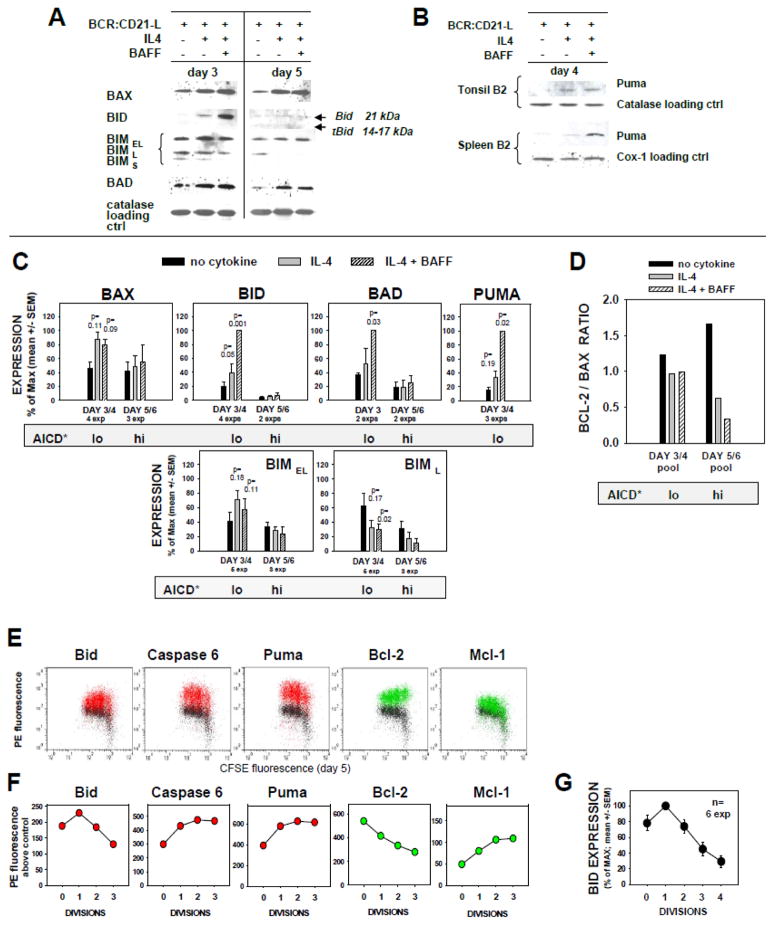
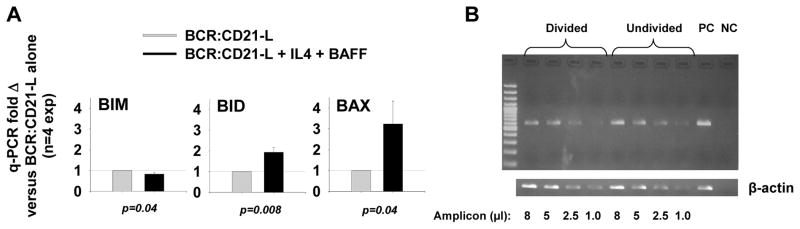
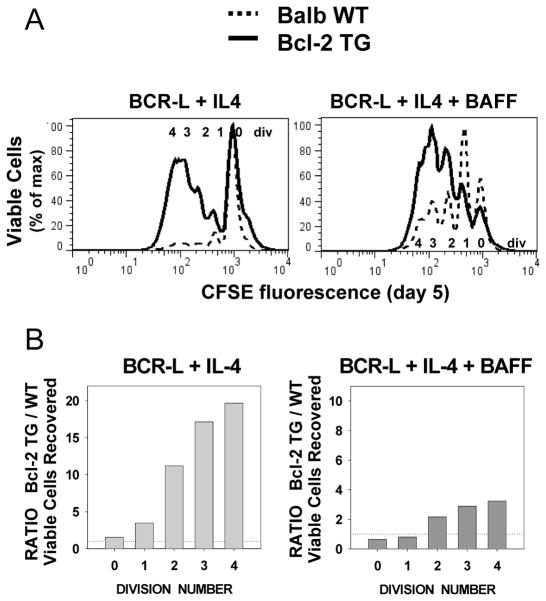
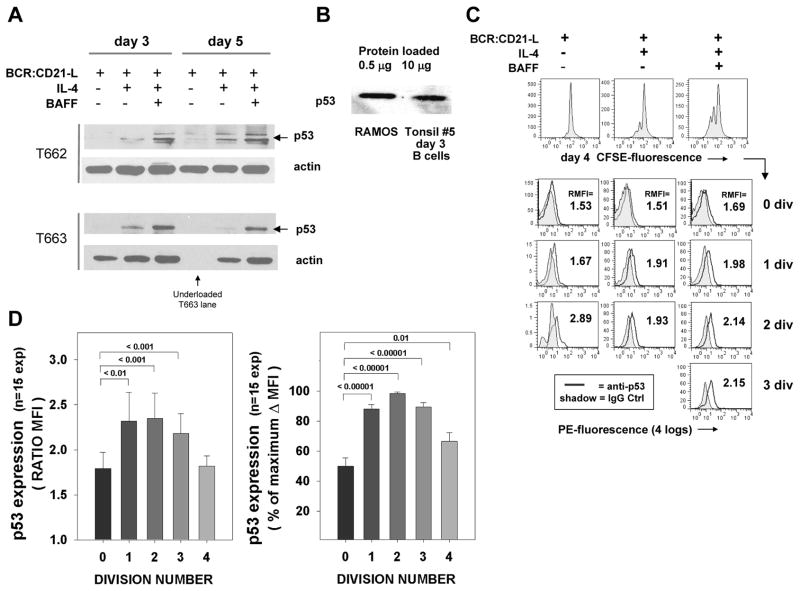
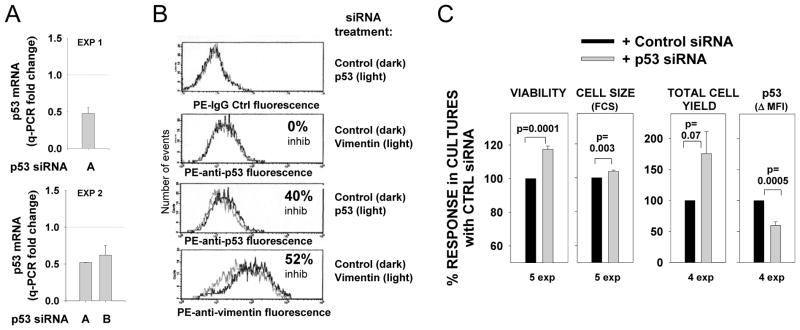
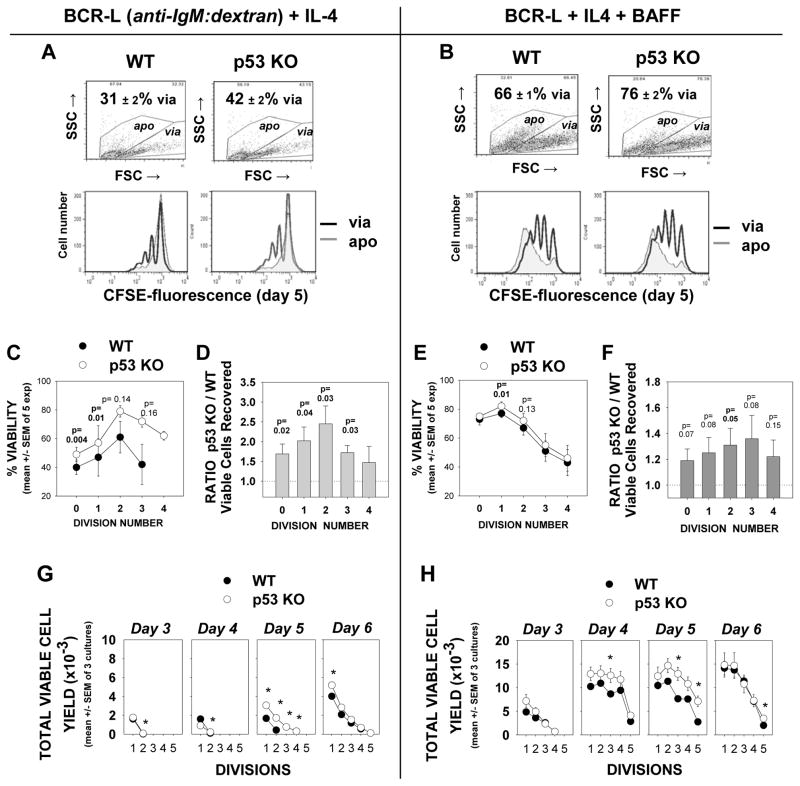
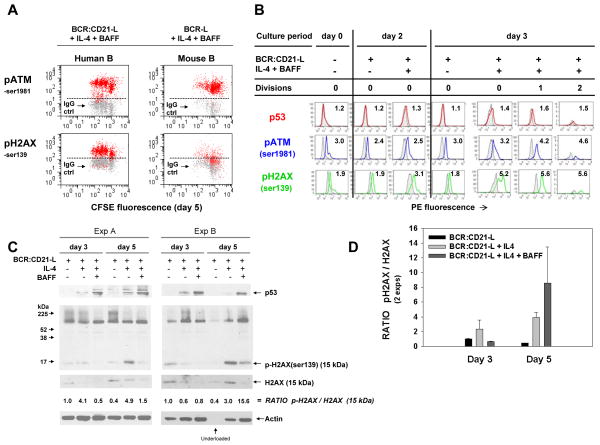
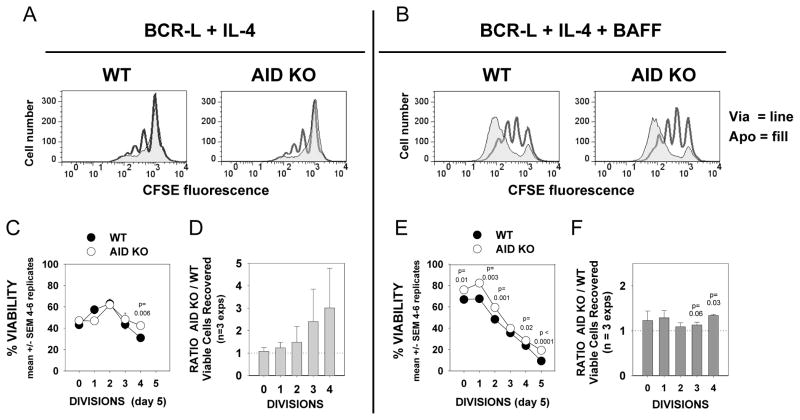
Resting mature human B cells undergo a dynamic process of clonal expansion, followed by clonal contraction, during an in vitro response to surrogate C3d-coated Ag and innate immune system cytokines, IL-4 and BAFF. In this study, we explore the mechanism for clonal contraction through following the time- and division-influenced expression of several pro- and anti-apoptotic proteins within CFSE-labeled cultures. Several findings, involving both human and mouse B cells, show that a mitochondria-dependent apoptotic pathway involving p53 contributes to the high activation-induced cell death (AICD) susceptibility of replicating blasts. Activated B cell clones exhibit elevated p53 protein and elevated mRNA/protein of proapoptotic molecules known to be under direct p53 transcriptional control, Bax, Bad, Puma, Bid, and procaspase 6, accompanied by reduced anti-apoptotic Bcl-2. Under these conditions, Bim levels were not increased. The finding that full-length Bid protein significantly declines in AICD-susceptible replicating blasts, whereas Bid mRNA does not, suggests that Bid is actively cleaved to short-lived, proapoptotic truncated Bid. AICD was diminished, albeit not eliminated, by p53 small interfering RNA transfection, genetic deletion of p53, or Bcl-2 overexpression. DNA damage is a likely trigger for p53-dependent AICD because susceptible lymphoblasts expressed significantly elevated levels of both phosphorylated ataxia telangiectasia mutated-Ser(1980) and phospho-H2AX-Ser(139). Deficiency in activation-induced cytosine deaminase diminishes but does not ablate murine B cell AICD, indicating that activation-induced cytosine deaminase-induced DNA damage is only in part responsible. Evidence for p53-influenced AICD during this route of T cell-independent clonal expansion raises the possibility that progeny bearing p53 mutations might undergo positive selection in peripherally inflamed tissues with elevated levels of IL-4 and BAFF.


Figures

FIGURE 1
FIGURE 1. Kinetics of caspase-dependent AICD following human B cell clonal expansion in response to surrogate C3d-coated Ag (BCR:CD21-L), IL-4 and BAFF
(A) CFSE-labeled, resting B cells were cultured with a limiting dose of BCR:CD21-L (0.01 μg/ml) + IL-4 and BAFF. Following varying culture intervals, cultures were pulsed with a known quantity of Autocomp beads, harvested, fixed with 2% formaldehyde, and analyzed by flow cytometry. 20,000 total events were acquired at each time point and FSC and SSC were evaluated on a log scale (left column, Figure 1A). This enabled detection of Autocomp beads (which have a lower FCS than the standardization beads used for assessing cell recovery in all other experiments (CountBright absolute counting beads; Invitrogen)). It also revealed that subcellular particles (debris = D) rise substantially after day 5 (6). For analysis of the divisions represented within intact viable and apoptotic cells (right column), events were gated on the basis of light scatter (as seen in left column) and analyzed for level of CFSE-fluorescence: dark lines = viable, tinted histogram = apoptotic. As described earlier (6), a fraction of undivided cells succumbs to death during the first 2 days of culture (far right apoptotic peak in CFSE histograms). These retain the high levels of CFSE present at the time of their demise and are unlikely related to activation, since they are seen at greater levels within non-stimulated cultures containing medium alone (6). (B) Calculations for % viability within each division subset of total intact cells (viable + apoptotic) were made from the cultures in Figure 1A, as described in our earlier studies (5, 6) and in the present materials and methods. It should be noted that these % viability determinations are not fully accurate because they do not account for the significant number of apoptotic cells which fragment into debris (D) and are excluded from consideration Nevertheless, the % viability calculations are valuable because they demonstrate that survival of highly divided progeny diminishes with time. (Note: % viability as determined by FSC/SSC-based gating of these cultured cells is comparable to % viability determinations on the basis of FITC-annexin V/PI staining (127) or PE-annexin/7-AAD staining (Supplementary Figure 1). (C) CFSE-labeled peripheral blood B cells and splenic FO B cells were cultured with BCR:CD21-L + IL-4 + BAFF for 5 days, gated into apoptotic and viable subsets as shown and evaluated for CFSE fluorescence. (In these and all subsequent experiments, FSC and SSC are plotted on linear scales, with the FSC threshold setting excluding most debris.) Similarly to activated tonsil FO (B2) cells, both these latter populations show evidence of significant AICD in replicating blasts (D) Cultures of activated B cells received a day 4 pulse of pan-caspase inhibitor, Z-VAD-FMK (40 μM), or DMSO vehicle control. Cultures were harvested on day 6, fixed, and analyzed by flow cytometry, Scatter plots to left show the gating of viable and apoptotic cells and the % viability values of replicate cultures within the experiment (mean ± SEM). Histograms to right represent day 6 CFSE fluorescence profiles for viable (solid) and apoptotic (dashed) cells. (Results representative of > 3 exps)
FIGURE 2
FIGURE 2. Profile of pro- and anti-apoptotic molecules displayed in BCR:CD21-L triggered B cells receiving co-stimuli from IL-4 ± BAFF
(A–D) Immunoblotting analyses of SDS-PAGE separated proteins in lysates of human FO cells cultured for 3–4 d or 5–6 d with BCR:CD21-L and medium, IL-4, or IL-4 + BAFF. (A) Lysates from a representative single experiment were analyzed for Bax, Bid, Bim, and Bad by sequential stripping and reblotting. In this experiment, d3 and d5 lysates were contemporaneously transferred to different blots, with subsequent simultaneous analysis. (B) Immunoblots from 2 separate experiments evaluating Puma within day 4 lysates. (C) Pooled analysis of the relative expression of Bax, Bid, Bad, Puma, and BimEL and BimL isoforms, within multiple experimental lysates collected at day 3–4 (prior to AICD) and at day 5–6 (AICD evident). Within each experiment, densitometric data for expression of the test molecule and loading control protein was obtained; values for the given test molecule were standardized on the basis of loading control in each experiment and calculated as % of maximum observed; and finally, all the latter values were from multiple experiments are expressed as mean ± SEM. P values for significance from Student’s t test are shown. The shaded bar below each set of pooled data indicates the relative propensity of cultures to display AICD, as shown in Figure 1 and elsewhere (6). (D) Bcl-2/Bax expression ratios were obtained for the differing culture conditions by dividing the mean values for Bcl-2 expression (as % of max from a past analysis (6) of the same lysates here analysed for Bax) by the mean values (% of max) for Bax expression. (E–F) Immunocytofluorimetric analysis of selected pro-apoptotic and anti-apoptotic molecules within CFSE-labeled blasts in 5 day cultures activated by BCR:CD21-L + IL-4 + BAFF. (E) Following intracellular staining with mAb to intact Bid, Caspase 6, Puma (red), or Bcl-2 or Mcl-1 (green), or alternatively IgG control (black), viable-gated cells were analyzed for expression of each protein within cells of differing division status by two color flow cytometry. (F) Shown are the calculated values for PE fluorescence intensity above IgG control background, for each CFSE-determined division. (Results representative of a minimum of 3 exps). (G) Mean ± SEM of % of max values for Bid expression in diverse division subsets (n=6 experiments).
FIGURE 3
FIGURE 3. Replicating B cells stimulated with BCR:CD21-L + IL-4 + BAFF exhibit elevated mRNA levels of Bid and Bax, but repressed Bim mRNA
(A) Cultures stimulated with BCR:CD21-L alone or with growth-promoting IL-4 and BAFF were harvested on day 4, mRNA isolated, and cDNA prepared with oligo(dT) primer. Quantitative PCR (q-PCR) was performed with primers specific for Bim, Bid, Bax, and β-actin. Δ Ct values for each of the above were obtained through comparison with β-actin. Values for fold difference (Δ) were obtained by comparing Δ Ct values for each pro-apoptotic mRNA in cytokine-supplemented cultures with the respective Δ Ct values in control cultures with BCR:CD21-L alone. The p values represent the significance of comparisons between Δ values in cytokine-supplemented cultures versus those in control cultures in a total of 4 replicate experiments, using two-tailed Students t test. (B) Bid mRNA levels in divided blasts are comparable to Bid mRNA in undivided blasts. For semi-quantitative RT-PCR of Bid, cells were stimulated for 5 days with BCR:CD21-L (0.01 μg/ml) + IL-4 + BAFF and sorted on the basis of CFSE fluorescence into two populations: undivided blasts and divided blasts (2–5 divisions). mRNA was isolated and cDNA prepared as above. PCR amplification was performed with Bid or β-actin-specific primers. Varying μl amounts of the amplicons were loaded onto 1.5% agarose gels and electrophoresed. PC=positive control and NC=negative control for PCR. (Similar results obtained from a 2nd experiment evaluating levels of Bid mRNA in undivided versus divided blasts).
FIGURE 4
FIGURE 4. Over-expression of Bcl-2 augments the recovery of viable lymphoblasts in mouse B cell TI clones
CFSE-labeled splenic B cells from Balb/c wild-type mice, and Balb/c mice over-expressing Bcl-2, due to insertion of a Bcl-2 TG, were stimulated for 5 days with BCR-L + IL-4 ± BAFF. Cultures were harvested following the addition of standardization beads to each well, fixed and analyzed by flow cytometry. (A) Shown are overlays of CFSE fluorescence within the viable-gated cells recovered from each set of congenic cultures, stimulated under the indicated conditions. (Results representative of two identical experiments). (B) Bcl-2 TG/WT (wild-type) ratio for total viable cell recovery within each division subset. Total viable cell recovery was computed, with the use of Count-bright standardization beads, from each of 6 replicates. A ratio was obtained by dividing mean value for Bcl-2 TG cultures by mean value for WT cultures in a representative experiment.
FIGURE 5
FIGURE 5. Levels of p53 are upregulated in human B cells triggered by BCR:CD21-L + IL-4 + BAFF
(A) Immunoblotting evidence for p53. Top: Day 3 and 5 lysates from tonsil FO cells stimulated with BCR:CD21-L ± IL-4 ± BAFF were analyzed for p53 and for β-actin loading control (following stripping and reblotting). A fresh blot and longer film exposure was used for p53 analysis T662 lysates, while a re-stripped blot with shorter film exposure was used for p53 analysis of T663 lysates. (p53 upregulation is representative of 6 experiments). (B) Comparative p53 levels within lysates of the human Ramos B cell line (expressing mutated p53) or day 3 normal human B cell cultures stimulated with BCR:CD21-L + IL-4 + BAFF. Note that the Ramos lysate was loaded at 1/20th of the total protein as the day 3-stimulated normal B cell lysate. (C) Flow cytometric evidence for p53. Top row: histograms representing CFSE-fluorescence in cells stimulated for 4 days with BCR:CD21-L with or without IL-4 ± BAFF, prior to intracellular staining. Subsequent rows: Stimulated cells were gated on the basis of CFSE fluorescence (division status) and assessed for PE fluorescence indicative of p53 staining (line) or IgG2b control staining (tinted histogram). Shown is the ratio of mean fluorescence intensity values (RMFI) obtained when anti-p53 MFI is divided by control MFI. The proportion of viable cells following into the 0, 1, 2, and 3 division subgroups in this experiment were as follows: BCR:CD21-L only: 92, 7, 1, and 0%; BCR:CD21-L + IL-4: 72, 18, 8 and 1%; BCR:CD21-L + IL-4 + BAFF: 49, 27, 19, and 5%, respectively. (D) Pooled data from 15 experiments evaluating the relative expression of p53 within the varying division subsets. The left plot shows data expressed as RMFI; the right plot shows data expressed as % of the maximal MFI above background (Δ MFI) within each experiment. The values above the bars show the p values for level of significance between p53 expression in undivided cells and cells with the indicated division.
FIGURE 6
FIGURE 6. p53 siRNA treatment of pre-activated human FO cells diminishes p53 protein expression but augments B cell viability, cell size and total cell yield
Purified FO cells from tonsils or spleens were pre-activated for 2 d (with either BCR:CD21-L, BCR:CD21-L + IL-4, or BCR:CD21-L + IL-4 + BAFF) prior to nucleofection with p53 siRNA, control siRNA (or vimentin siRNA) as described in materials and methods. (A) mRNA was isolated from cells at 24–32 hours post nucleofection. cDNA was prepared and analyzed for p53 and actin levels by q-PCR with specific primers. Values for Δ Ct values were obtained as described for Figure 3A; fold-change was calculated by comparing Δ Ct values within p53 siRNA-treated cultures with respective Δ Ct values in cultures treated with control siRNA. Shown are fold-change values from transfections performed with two distinct activated B cell populations and two different sources of p53 siRNA (mean +/−SEM values from replicate qPCR assays are shown). (B) Cells were harvested at 3 days following nucleofection with the indicated siRNA and fixed, permeabilized and stained intracellularly with PE-anti-p53 antibody, PE-anti-vimentin, or PE-IgG control. Shown is PE fluorescence histograms on a 4-log scale. (C) At 3 to 4 days after nucleofection, fixed cells were analyzed for cell viability (by light scatter), cell size (by FSC of viable subset), and total cell yield (as determined with standardization beads, or in the first experiment, by comparison of “events per minute” during acquisition of cells from control and p53 siRNA-treated cultures). To standardize data from multiple experiments, values for each parameter within an experiment were expressed as a % of the value obtained with control siRNA-treated cells. Shown are the mean ± SEM values of such values. A two-tailed, non-paired Student’s t test was used to compare the responses in cultures treated with p53 siRNA versus control siRNA (p values of significance are shown).
FIGURE 7
FIGURE 7. cultures of p53-deficient mouse B cells exhibit greater viability and greater total lymphoblast yield than similarly activated cultures of wild-type mouse B cells
CFSE-labeled high density splenic B cells from C57BL/6 WT and p53-KO congenic mice were stimulated for 5 days with BCR-L + IL-4 ± BAFF. Cultures were harvested with standardization beads, fixed and analyzed by flow cytometry for % viability within each division subset, as well as total viable cell recovery, within each gated division subset (6). (A,B) Top dot plots: Comparisons of total culture viability in each of the treated cell groups, on the basis of FSC/SSC gating (mean ± SEM for 5 replicate cultures in an experiment is shown). Bottom histograms: Overlays of CFSE-fluorescence within gated viable (dark line) and apoptotic (grey shadow) cells from cultures of WT or p53-KO B cells in a representative experiment (of five). Cultures were seeded with equivalent numbers of cells and each plot represents a total of 40,000 events collected, using an identical scale for cell number. (C,E) % viability values for each division subset in p53 KO and WT B cell cultures were calculated for each of 5 experiments and expressed as mean ± SEM. p values were calculated with the Student’s t test. Darkened p values show the division subsets where statistical significance was reached. Lighter p values show those of borderline statistical significance. (D,F) p53 deficiency provides a bonus for viable cell yield: Total number of viable cells recovered within each division subset was determined, with the use of standardization beads. A ratio of the total cells recovered in p53 KO cultures versus the recovery in WT cultures was calculated for each experiment. Shown are the mean ± SEM of these values from 5 experiments. P values are shown for the division subsets in which the p53 KO/WT Ratio was significantly (dark) or near-significantly (light) different from the control value of “1”. (G,H) Kinetic analysis of total viable cell yield within p3 KO and WT cultures stimulated with either BCR-L + IL-4 (G) or BCR-L + IL4 and BAFF (H). Note that the greater yield of viable blasts in p53 KO cultures is most significant from days 4–5; by day 6, the number of viable highly divided blasts in the p53 KO cultures drops, possibly reflecting induction of “mitotic catastrophe” as discussed in the text.
FIGURE 8
FIGURE 8. pATM-ser1981 and pH2AX-ser139 expression is elevated in human and mouse B lymphoblasts undergoing TI activation
(A) Cultures of human and mouse CFSE-labeled B cells were stimulated as indicated, harvested on day 5, and stained intracellularly for molecules indicative of DNA double strand breaks (phosphorylated ATM and H2AX), in the presence of phosphatase inhibitors. The human B cell cultures were pulsed with the pan-caspase inhibitor, Z-VAD (20 μM) on day 4 to diminish apoptosis of activated B cells with DNA damage. (Z-VAD was absent in the mouse cultures.) Plots of human B cells are representative of 4 experiments; plots of mouse B cells are representative of 2 experiments. ATM is known to be autophosphorylated and activated upon binding DNA double stand breaks; activated pATM-ser1981 targets histone H2AX for phosphorylation at ser139 (55, 128). The dotted horizontal line indicate the PE intensity below which are > 95% of the cells stained with IgG control. (B) Comparison of the time course of p53, pATM-ser1981, and pH2AX-ser139 expression in CFSE-labeled cells exposed to BCR:CD21-L alone or in combination with IL-4 and BAFF. Purified unlabeled cells prior to culture, or after CFSE-labeling and 2 and 3 days of culture with the above stimuli, were frozen in an optimal DMSO:FSC-based cell freezing solution until simultaneous defrosting for analysis of p53, pATM, and pH2AX by flow cytometry. Shown are the overlaid histograms of viable-gated cells stained with the indicated specific mAb or with the respective IgG control. Values shown represent RMFI, as calculated in Figure 5. (C) Evidence for upregulation of pH2AX-ser139 by immunoblotting. Lysates from activated cultures were immunoblotted for p53, as in Figure 5A. Following stripping, they were reblotted for the ser-139 phosphorylated form of H2AX, total H2AX, and β-actin. Shown are ratiometric values for the relative degree of H2AX phosphorylation (an indicator of DNA damage) within the various cultures. Not considered in this calculation is an undefined band of high molecular weight which was quite prominent in this and a replicate experiment upon immunoblotting with the anti-pH2AX-ser139 mAb. As discussed in the text, the latter might represent a complex of p-H2AX with other protein(s) known to cluster in areas of DNA damage. It may be of relevance that both experimental sets of lysates, a low ratio in d3 cultures supplemented with both IL-4 and BAFF was accompanied by evidence of a very prominent band between the 52–225 kDa markers in the p-H2AX blots (the intensity of this upper band always exceeded that seen under other stimulation conditions, both at day 3 and day 5.) (D) Bar graph showing ratios of pH2AX densitometric intensity to total H2AX intensity (mean ± SEM of the 15 kDa band in two replicate experiments.)
FIGURE 9
FIGURE 9. TI stimulation of AID-deficient mouse B cells yields a slight, but significant, increase in viable lymphoblast recovery as compared to wild-type mouse B cells
CFSE-labeled high density splenic B cells from C57BL/6 WT and AID-KO congenic mice were cultured at the same density for 5 days with BCR-L + IL-4 ± BAFF. Cultures were processed as in Figure 7. (A,B) Overlays of the CFSE-fluorescence histograms from a representative experiment (of 3) with WT and AID-KO B cells, gated as viable (red) or apoptotic (black). (C and E) % viability values for cells in each gated division subset were calculated for the 4–6 replicates within one experiment. Shown is the intra-experimental mean ± SEM values for % viability in the AID-KO and WT B cell cultures. (p values show that % viability values from the two sets of cultures are significantly different.) (D and F) The total number of recovered viable cells within each division subgroup was determined for each of 3 experiments, and expressed as a ratio of the yield in AID KO versus WT cultures (as in Figure 7). Any bonus in viable cell recovery attributed to AID-deficiency is indicated by a ratio greater than 1. The p values are shown for divisions in which these inter-experimental ratios were (p=0.03), or approached (p=0.06), statistical significance, as compared to WT control values of 1. It should be noted that, although the ratios for infrequent viable cells reflecting 4 divisions was not significantly different in the cultures with BCR-L + IL-4, this reflected the wide spread in ratios between the 3 experiments (1.84, 1.28, and 6.53); in all experiments the AID KO/WT ratio was greater than the WT control value of 1. (Mean ± SEM values for the absolute number of viable cells representing 4 divisions (in 5–6 replicate cultures per each of 3 experiments) were 154 ± 69, 2205 ± 90, and 270 ± 37 (WT cultures) as compared to 284 ± 96, 2816 ± 274, and 1764 ± 222 (AID KO), respectively.

Similar articles

Cited by

References

    1. de Vinuesa CG, Cook MC, Ball J, Drew M, Sunners Y, Cascalho M, Wabl M, Klaus GG, MacLennan IC. Germinal centers without T cells. J Exp Med. 2000;191:485–494. - PMC - PubMed
    1. El Shikh ME, El Sayed RM, Szakal AK, Tew JG. T-independent antibody responses to T-dependent antigens: a novel follicular dendritic cell-dependent activity. J Immunol. 2009;182:3482–3491. - PubMed
    1. Baumgarth N. A two-phase model of B-cell activation. Immunol Rev. 2000;176:171–180. - PubMed
    1. Defrance T, Taillardet M, Genestier L. T cell-independent B cell memory. Curr Opin Immunol. 2011;23:330–336. - PubMed
    1. Mongini PK, Inman JK, Han H, Fattah RJ, Abramson SB, Attur M. APRIL and BAFF promote increased viability of replicating human B2 cells via mechanism involving cyclooxygenase 2. J Immunol. 2006;176:6736–6751. - PubMed

Publication types

MeSH terms