. 2012:2012:282574.
doi: 10.1155/2012/282574. Epub 2011 Dec 15.

Electrospray ionization mass spectrometry: a technique to access the information beyond the molecular weight of the analyte

Affiliations

Electrospray ionization mass spectrometry: a technique to access the information beyond the molecular weight of the analyte

Shibdas Banerjee et al. Int J Anal Chem. 2012.

Abstract

The Electrospray Ionization (ESI) is a soft ionization technique extensively used for production of gas phase ions (without fragmentation) of thermally labile large supramolecules. In the present review we have described the development of Electrospray Ionization mass spectrometry (ESI-MS) during the last 25 years in the study of various properties of different types of biological molecules. There have been extensive studies on the mechanism of formation of charged gaseous species by the ESI. Several groups have investigated the origin and implications of the multiple charge states of proteins observed in the ESI-mass spectra of the proteins. The charged analytes produced by ESI can be fragmented by activating them in the gas-phase, and thus tandem mass spectrometry has been developed, which provides very important insights on the structural properties of the molecule. The review will highlight recent developments and emerging directions in this fascinating area of research.


Figures

Figure 1
Figure 1
Yearly histogram of the papers dealing with the use of electrospray ionization after the Fenn's introduction of electrospray ionization mass spectrometry to ionize the biomolecules in 1989. The information was obtained by searching ISI Web of Knowledge on 26.06.2011 for the term “Electrospray ionization.”
Figure 2
Figure 2
The basic components of the ESI-mass spectrometer.
Figure 3
Figure 3
A schematic representation of the ESI-ion source.
Figure 4
Figure 4
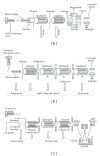
Schematic of the (a) thermo-Finnigan LCQ Deca mass spectrometer (on-axis spray), (b) Agilent 6410 Triple Quad LC/MS system (off-axis/orthogonal spray), and (c) Waters Micromass Q-TOF Ultima ESI-MS (z-spray).
Figure 5
Figure 5
A typical cartoon representing the nature of ESI-mass spectrum in positive ion mode.
Figure 6
Figure 6
Schematic representation of the electrospray ionization process.
Figure 7
Figure 7
Time history of the charged methanol droplet produced by microelectrospray process. The droplet at the top left is a typical parent droplet created at the ES capillary tip. The successive solvent evaporation and Coulomb fission leads to the charged nanodroplets that are the precursors of the gas-phase analyte ions. The numbers beside the droplets give radius R (μm) and number of elementary charges N on the ES droplet; Δt corresponds to the time required for evaporative droplet shrinkage to size where fission occurs. Only the first three successive fissions of a parent droplet are shown. At the bottom right, the fission of the offspring droplet to produce the charged nanodroplets is shown. The inset shows a drawing of droplet jet fission based on actual flash microphotograph. (Adapted with permission from [22], Copyright 1993, American Chemical Society).
Figure 8
Figure 8
Plot of the average charge state (z) against molecular mass (m) for various proteins that follow CRM. [(•) Observed highest charge state; () observed lowest charge state; solid curve corresponds to the average charge state predicted by (4)]. The molecular weights of the proteins given on the x-axis are in units of 106 Da. (Reprinted with permission from Analytica Chimica Acta [61], Copyright 2000, Elsevier).
Figure 9
Figure 9
Hypothetical picture of a charge droplet containing five analytes of different shapes and sizes at three different stages of the solvent evaporation before Coulomb fission.
Figure 10
Figure 10
The proton transfer reaction responsible for protein charging in gas phase via ESI.
Figure 11
Figure 11
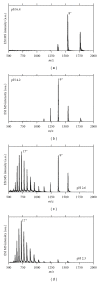
ESI-mass spectra of cyt c in water containing 3% methanol and 0.5 mM ammonium acetate at (a) pH 6.4, (b) pH 4.2, (c) pH 2.6, and (d) pH 2.3. The pH was adjusted by the addition of hydrochloric acid. (Reprinted with permission from Biochemistry [80], Copyright 1997, American Chemical Society).
Figure 12
Figure 12
Correlation between the average charge state of protein ions generated by ESI under near-native conditions (10 mM ammonium acetate, pH adjusted to 7) and their surface areas in solution, whose calculation was based upon their crystal structures. The data are plotted in the logarithmic scale (a graph plotted in the normal scale is shown in the inset). A gray-shaded dot represents a pepsin data point. An open circle underneath represents the highest charge of pepsin if the extent of multiple charging was limited by the number of basic residues within the protein molecule. (Reprinted with permission from Analytical Chemistry [77], Copyright 2005, American Chemical Society).
Figure 13
Figure 13
Nano-ESI-mass spectrum of 25 μM ubiquitin in 1 mM NaCl solution. The spectrum was obtained at low nozzle-skimmer potential, so that there was little collisional activation of the protein. It is obvious that each charge state is not a single peak but consists of multiple peaks due to the adduct formation of the salt ions (e.g., Na+ & Cl) with ubiquitin. (Reprinted with permission from Journal of the American Society for Mass Spectrometry [91], Copyright 2005, Elsevier).
Figure 14
Figure 14
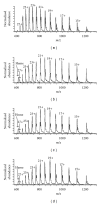
Myoglobin (10−5 M) electrosprayed from 47%/50%/3% water/solvent/acetic acid solutions, where the “solvent” was (a) water, (b) methanol, (c) acetonitrile, or (d) isopropanol. (Reprinted with permission from Journal of the American Society for Mass Spectrometry [96], Copyright 2000, Elsevier).
Figure 15
Figure 15
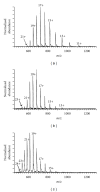
Electrospray ionization mass spectra of cytochrome c (10−5 M) from solutions containing (a) 0, (b) 0.3, and (c) 0.7% m-NBA. The base solution is 47/50/3% water/methanol/acetic acid. (Reprinted with permission from Analytical Chemistry [101], Copyright 2001, American Chemical Society).
Figure 16
Figure 16
Mobile proton model. (Reprinted with permission from Journal of the American Society for Mass Spectrometry [156], Copyright 2010, Elsevier).
Scheme 1
Scheme 1
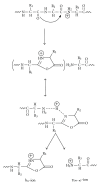
The fragmentation pathway of the cationic complex 1 inside the charged droplet.
Scheme 2
Scheme 2
A mechanism for the production of bn and yn ions.
Figure 17
Figure 17
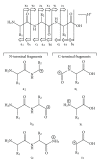
Nomenclature of the peptide fragments showing some typical qualitative structure of the fragments.
Figure 18
Figure 18
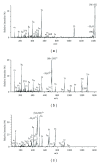
CID-MS/MS spectra of different protonated forms of the peptide HSDAVFTDNYTR: (a) CID of singly protonated peptide [M + H]+, (b) CID of doubly protonated peptide [M + 2H]2+, and (c) CID of triply protonated peptide [M + 3H]3+. (Reprinted with permission from Analytical Chemistry [157], Copyright 1993, American Chemical Society).
Figure 19
Figure 19
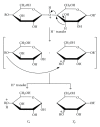
Nomenclature of the product ions formed from the precursor oligosaccharide.
Scheme 3
Scheme 3
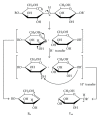
The proposed mechanism of the formation of Bn and Ym product ions via ion-dipole complex.
Scheme 4
Scheme 4
Proposed mechanism of the formation of Ci & Zj product ions via ion-dipole complex.
Scheme 5
Scheme 5
The fragmentation mechanism of the oligonucleotide in two different ways. The mechanism in the upper panel shows the necessity of a charge proximate to the cleavage site. The mechanism in the lower panel does not require the charge proximate.
Figure 20
Figure 20
Nomenclature of the fragment ions produced by the CID of oligonucleotides.
Scheme 6
Scheme 6
The charge remote fragmentation (CRF) mechanism for the formation of distonic ions (anions) and terminally unsaturated ions (anions).
Figure 21
Figure 21
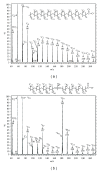
400 eV (E lab) CID spectra of stearic acid (a) and oleic acid (b) pseudomolecular anion. (Reprinted with permission from Rapid Communication in Mass Spectrometry [214], Copyright 1996, John Wiley and Sons).
Figure 22
Figure 22
The charge remote fragmentation of bile acids (metabolites of cholesterol) with the nomenclature of different fragments.

References

    1. Thomson JJ. Rays of Positive Electricity and Their Applications to Chemical Analysis. London, UK: Longmans Green; 1913.
    1. Grayson M. John Bennett Fenn: a curious road to the prize. Journal of The American Society for Mass Spectrometry. 2011;22(8):1301–1308. - PubMed
    1. Barber M, Bordoli RS, Sedgwick RD, Tyler AN. Fast atom bombardment of solids (F.A.B.): a new ion source for mass spectrometry. Journal of the Chemical Society, Chemical Communications. 1981;(7):325–327.
    1. Fenn JB, Mann M, Meng CK, Wong SF, Whitehouse CM. Electrospray ionization for mass spectrometry of large biomolecules. Science. 1989;246(4926):64–71. - PubMed
    1. Przybylski M, Glocker MO. Electrospray mass spectrometry of biomacromolecular complexes with noncovalent interactions—New analytical perspectives for supramolecular chemistry and molecular recognition processes. Angewandte Chemie. 1996;35(8):807–826.

LinkOut - more resources