. 2012:2012:254960.
doi: 10.1155/2012/254960. Epub 2012 May 7.

Solanum lyratum Extracts Induce Extrinsic and Intrinsic Pathways of Apoptosis in WEHI-3 Murine Leukemia Cells and Inhibit Allograft Tumor

Affiliations

Solanum lyratum Extracts Induce Extrinsic and Intrinsic Pathways of Apoptosis in WEHI-3 Murine Leukemia Cells and Inhibit Allograft Tumor

Jai-Sing Yang et al. Evid Based Complement Alternat Med. 2012.

Abstract

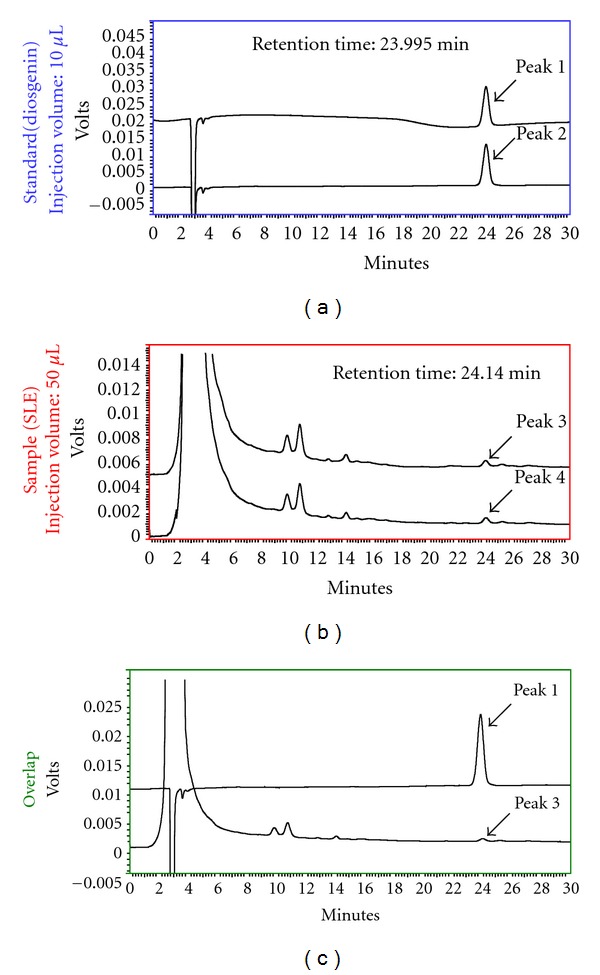
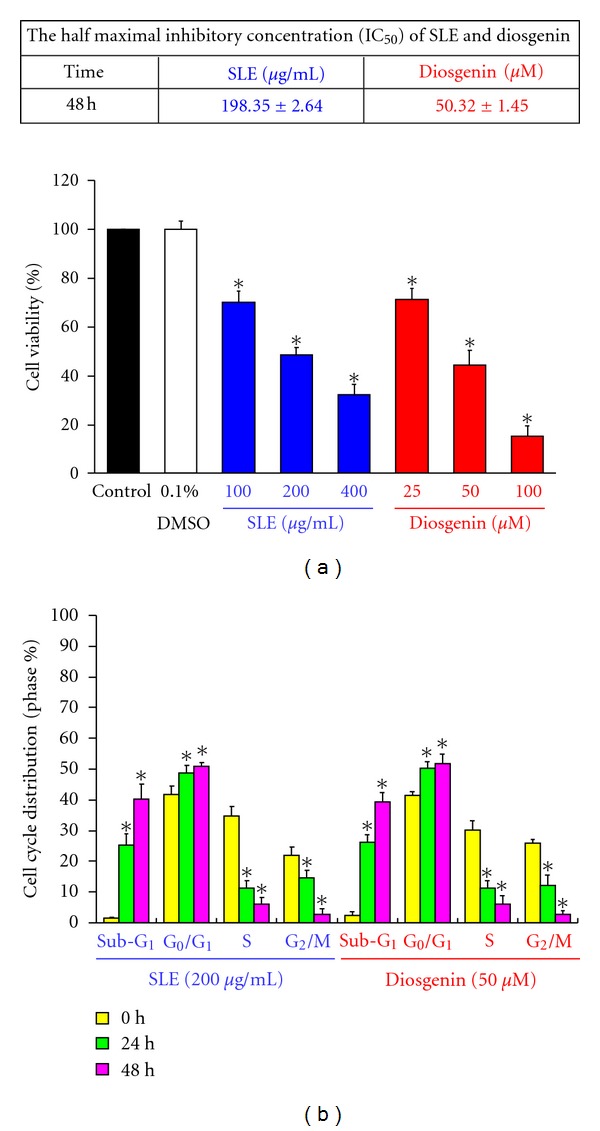
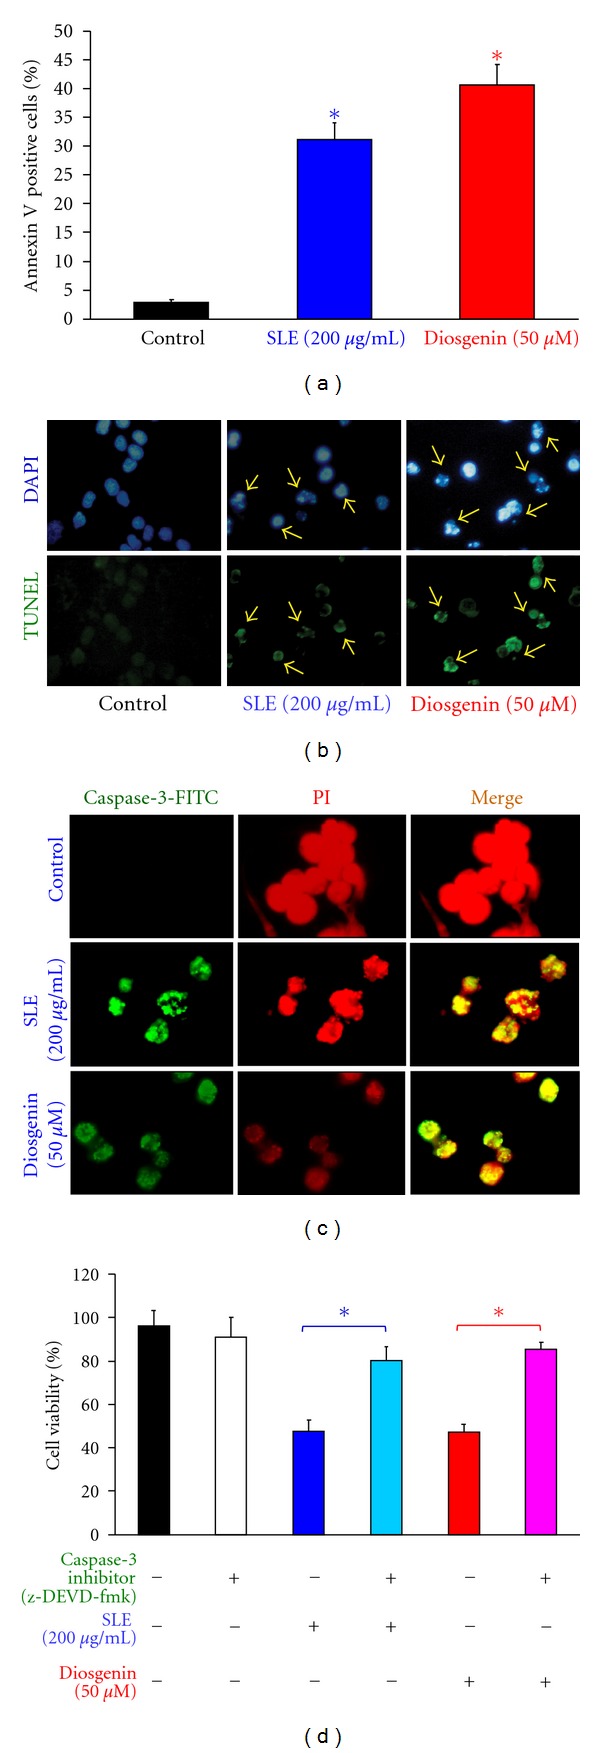
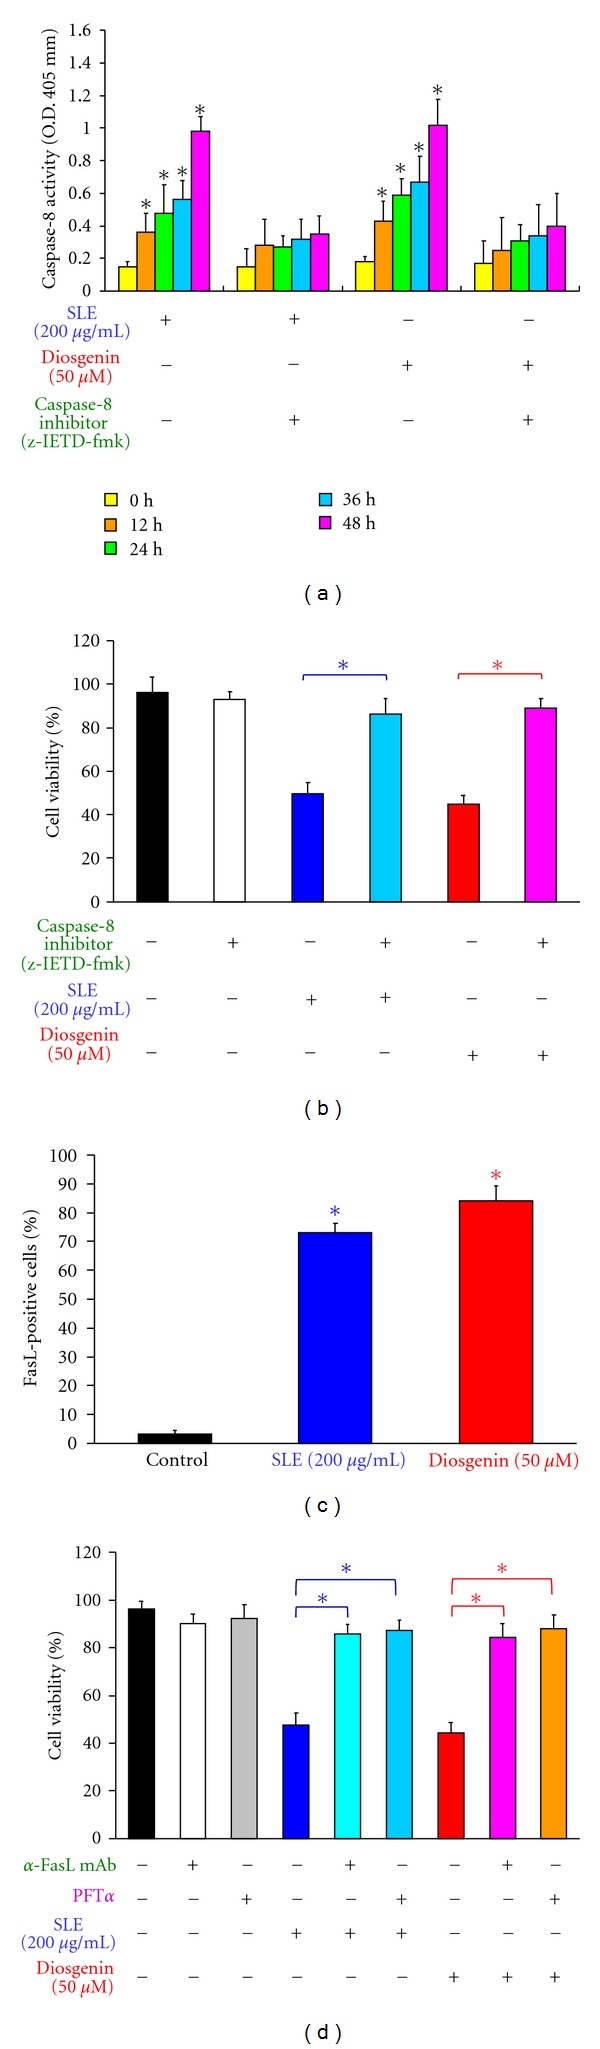
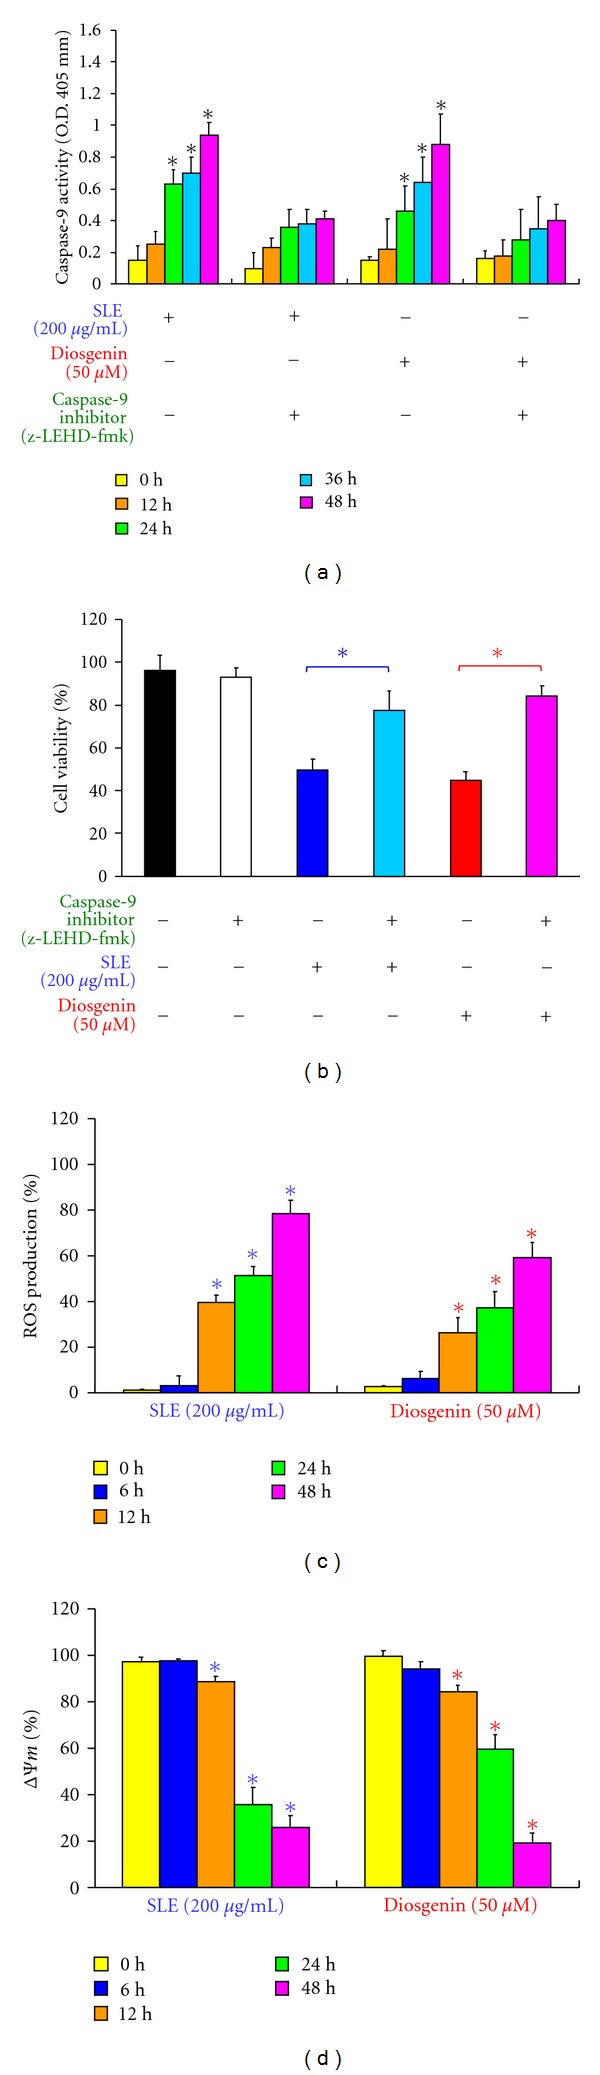
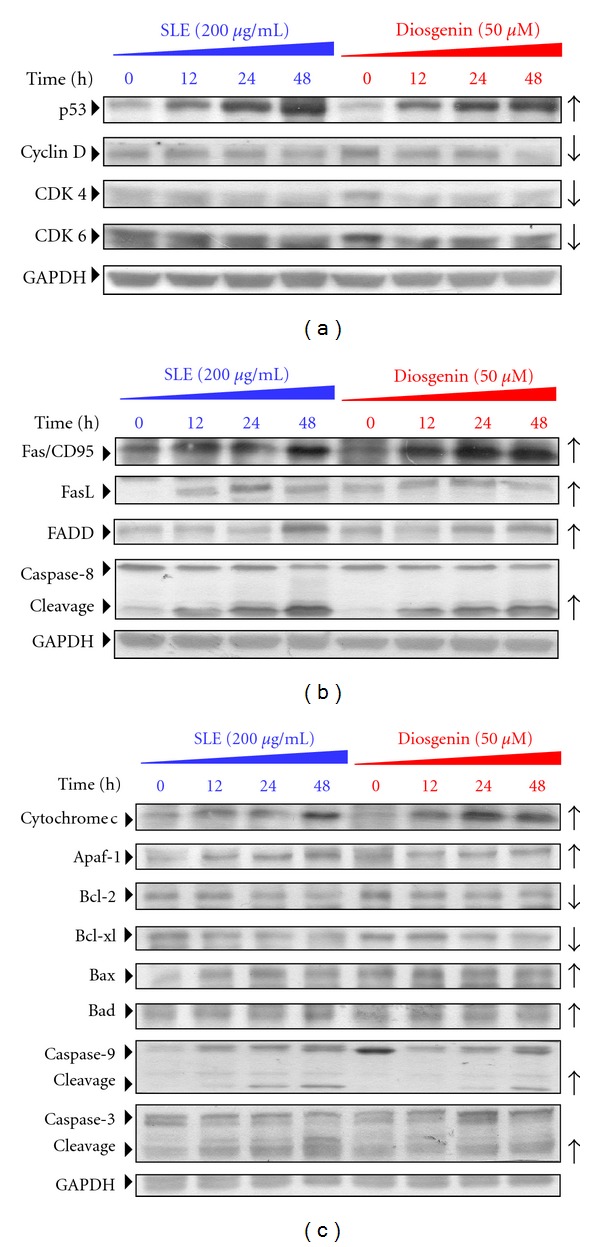
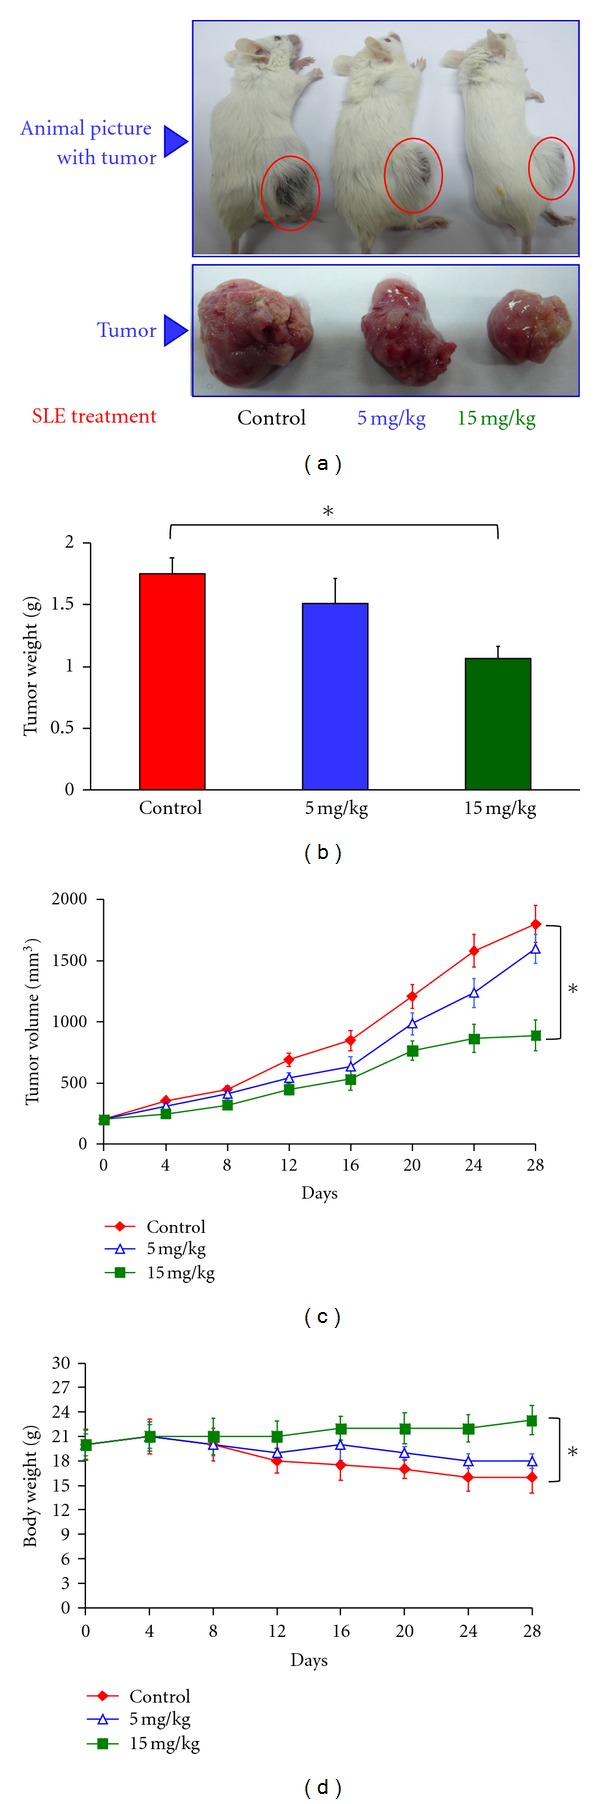
We investigated the molecular mechanisms of cell cycle arrest and apoptotic death induced by Solanum lyratum extracts (SLE) or diosgenin in WEHI-3 murine leukemia cells in vitro and antitumor activity in vivo. Diosgenin is one of the components of SLE. Our study showed that SLE and diosgenin decreased the viable WEHI-3 cells and induced G(0)/G(1) phase arrest and apoptosis in concentration- or time-dependent manners. Both reagents increased the levels of ROS production and decreased the mitochondrial membrane potential (ΔΨ(m)). SLE- and diosgenin-triggered apoptosis is mediated through modulating the extrinsic and intrinsic signaling pathways. Intriguingly, the p53 inhibitor (pifithrin-α), anti-Fas ligand (FasL) mAb, and specific inhibitors of caspase-8 (z-IETD-fmk), caspase-9 (z-LEHD-fmk), and caspase-3 (z-DEVD-fmk) blocked SLE- and diosgenin-reduced cell viability of WEHI-3 cells. The in vivo study demonstrated that SLE has marked antitumor efficacy against tumors in the WEHI-3 cell allograft model. In conclusion, SLE- and diosgenin-induced G(0)/G(1) phase arrest and triggered extrinsic and intrinsic apoptotic pathways via p53 activation in WEHI-3 cells. SLE also exhibited antitumor activity in vivo. Our findings showed that SLE may be potentially efficacious in the treatment of leukemia in the future.


Figures

Figure 1
Figure 1
The content of diosgenin in SLE was analyzed by HPLC. HPLC was performed on SHIMADZU (Japan) two solvent delivery system model CBM-20A together with a model RID-10A refractive index detector. Data acquisition was performed using SHIMADZU Class-VP software. Chromatography was carried out on a Cosmosil 5C-18 MSII column (250 × 4.6 mm i.d.). Isocratic elution was performed with water and HPLC-grade methanol (10/90, v/v) at a flow rate of 1 mL/min. Pure diosgenin (peak 1 and peak 2) showed a retention time at 23.995 min (top), SLE (peak 3 and peak 4) showed a retention time at 24.140 min. (middle) and overlapping analysis (bottom).
Figure 2
Figure 2
The effects of SLE and diosgenin on cell viability and cell cycle distribution in WEHI-3 cells. (a) Cells were treated with SLE (0, 100, 200, and 400 μg/mL) or diosgenin (0, 25, 50, and 100 μM) for 48 h. Percentage of viable cells was determined by PI exclusion method. Data are presented as the mean ± S.E.M. of three independent experiments. *, P < 0.05, significantly different compared with control treatment. (b) Cells were treated with 200 μg/mL of SLE or 50 μM of diosgenin for 24 and 48 h. The cell cycle distribution was determined using flow cytometric analysis and cell cycle distribution was quantified. Data are presented as the mean ± S.E.M. of three independent experiments. *, P < 0.05, significantly different compared with 0 h treatment.
Figure 3
Figure 3
SLE- and diosgenin-induced apoptosis and caspase-3 activation in WEHI-3 cells. Cells were treated with 200 μg/mL of SLE or 50 μM of diosgenin for 12 h. (a) Annexin V/PI analysis was determined by flow cytometric assay. Apoptotic cell population (Annexin V positive cells) was quantified as described in materials and methods. Data are presented as the mean ± S.E.M. of three independent experiments.*, P < 0.05, significantly different compared with control treatment. Cells were treated with 200 μg/mL of SLE or 50 μM of diosgenin for 48 h. (b) DAPI/TUNEL analysis and (c) caspase-3 protein location were determined by immunostaining and photographed by fluorescence microscopic systems as described in materials and methods (400X) (↑DNA fragmentation). (d) Cells were pretreated with specific inhibitor of caspases-3 (z-DEVD-fmk) for 1 h after exposure to SLE (200 μg/mL) or diosgenin (50 μM) for 48 h exposure. The cells were collected to determine the percentage of viable cells. Data are presented as the mean ± S.E.M. of three independent experiments. *, P < 0.05, significantly different compared with SLE-treated cells.
Figure 4
Figure 4
Effects of SLE and diosgenin on WEHI-3 cells in the extrinsic apoptotic pathway. Cells were pretreated with specific inhibitors of caspases-8 (z-IETD-fmk) for 1 h after exposure to SLE (200 μg/mL) or diosgenin (50 μM) for 12, 24, 36, and 48 h. (a) The whole-cell lysates were subjected to caspase-8 activity and (b) cells were collected after SLE or diosgenin for a 48 h treatment to determine the percentage of viable cells. (c) Cells were incubated with 200 μg/mL of SLE or 50 μM of diosgenin for 24 h, and FasL protein expression was detected by immunostaining and analysis by flow cytometry. (d) Cells were pretreated with anti-FasL mAb or specific inhibitor of p53 (PFTα) for 1 h after exposure to SLE (200 μg/mL) or diosgenin (50 μM) for a 48 h exposure. Cells were collected to determine the percentage of viable cells. Data are presented as the mean ± S.E.M. of three independent experiments. *, P < 0.05, significantly different compared with SLE-treated cells.
Figure 5
Figure 5
Effects of SLE and diosgenin on WEHI-3 cells in the intrinsic apoptotic pathway. Cells were pretreated with specific inhibitor of caspases-9 (z-LEHD-fmk) for 1 h after exposure to SLE (200 μg/mL) or diosgenin (50 μM) for 12, 24, 36, and 48 h. (a) The whole-cell lysates were subjected to caspase-9 activity assay and (b) cells were collected after SLE or diosgenin for a 48 h treatment to determine the percentage of viable cells. Data are presented as the mean ± S.E.M. of three independent experiments. *, P < 0.05, significantly different compared with SLE treatment. (c) The reactive oxygen species (ROS) of SLE- or diosgenin-treated WEHI-3 cells from each time point were measured by staining with H2DCF-DA. (d) The mitochondrial membrane potential (ΔΨm) of both reagents-treated WEHI-3 cells was measured by staining with DiOC6. Data are presented as the mean ± S.E.M. of three independent experiments. *, P < 0.05, significantly different compared with 0 h treatment.
Figure 6
Figure 6
SLE and diosgenin altered the levels of G0/G1 phase and apoptotic relative proteins in WEHI-3 cells. Cells were exposed to SLE (200 μg/mL) or diosgenin (50 μM) and then incubated for 12, 24, and 48 h. The protein levels of (b) p53, cyclin D, CDK4, and CDK6, (b) Fas/CD95, FasL, FADD, Caspase-8, and GAPDH (b), and (c) cytochrome c, Apaf-1, Bcl-2, Bcl-xl, Bax, Bad, caspase-9, caspase-3, and GAPDH in SLE-treated WEHI-3 cells were determined by Western blotting. Data are presented as the mean ± S.E.M. of three independent experiments. *, P < 0.05, significantly different compared with 0 h treatment.
Figure 7
Figure 7
SLE inhibited tumor growth in the WEHI-3 cells allograft model. Eighteen BALB/c mice were subcutaneously implanted with 1 × 107 WEHI-3 cells. When tumors reached the volume of 100 mm3, the mice were randomly divided into three groups (six mice/group). Group 1 was orally treated with control vehicle (olive oil) daily; group 2 was orally treated with 5 mg/kg of SLE daily; group 3 was orally treated with 15 mg/kg of SLE daily. At day 28, all animals were sacrificed. Representative (a) animals with tumor, (b) tumor weight, (c) solid tumor volume, and (d) body weight from each animal were shown. Data are presented as the mean ± S.E.M. of six animals at day 0 to 28 after tumor implantation. *, P < 0.05, significantly different compared with control.

References

    1. Lin JP, Yang JS, Lin JJ, et al. Rutin inhibits human leukemia tumor growth in a murine xenograft model in vivo . Environmental Toxicology. 2011;13(4) - PubMed
    1. Sack H. Leukemia in patients with breast carcinoma after adjuvant chemotherapy and/or postoperative radiotherapy. Strahlentherapie Und Onkologie. 1995;171(7):420–421. - PubMed
    1. Green DR, Reed JC. Mitochondria and apoptosis. Science. 1998;281(5381):1309–1312. - PubMed
    1. Riedl SJ, Salvesen GS. The apoptosome: signalling platform of cell death. Nature Reviews Molecular Cell Biology. 2007;8(5):405–413. - PubMed
    1. Kerr JF, Wyllie AH, Currie AR. Apoptosis: a basic biological phenomenon with wide-ranging implications in tissue kinetics. British Journal of Cancer. 1972;26(4):239–257. - PMC - PubMed