. 2012 Oct;19(7):598-609.
doi: 10.1111/j.1549-8719.2012.00193.x.

Low proliferative potential and impaired angiogenesis of cultured rat kidney endothelial cells

Affiliations

Low proliferative potential and impaired angiogenesis of cultured rat kidney endothelial cells

David P Basile et al. Microcirculation. 2012 Oct.

Abstract

Objective: CKD is histologically characterized by interstitial fibrosis, which may be driven by peritubular capillary dropout and hypoxia. Surprisingly, peritubular capillaries have little repair capacity. We sought to establish long-term cultures of rat kidney endothelial cells to investigate their growth regulatory properties.

Methods: AKEC or YKEC were isolated using CD31-based isolation techniques and sustained in long-term cultures.

Results: Although YKEC grew slightly better than AKEC, both performed poorly compared with endothelial cells of the rat adult PMVEC, PAEC, or HUVEC cells. PMVEC and PAEC contained a large percentage of cells with high colony-forming potential. In contrast, KECs were incapable of forming large colonies and most remained as single nondividing cells. KEC expressed high levels of mRNA for VEGF receptors, but were surprisingly insensitive to VEGF stimulation. KEC did not form branching structures on Matrigel when cultured alone, but in mixed cultures, KEC incorporated into branching structures with PMVEC.

Conclusions: These data suggest that the intrinsic growth of rat kidney endothelial cells is limited by unknown mechanisms. The low growth rate may be related to the minimal intrinsic regenerative capacity of renal capillaries.


Figures

Figure 1
Figure 1
Characterization of the rat kidney derived endothelial cells. Figure 1A shows phase contrast image of cultured rat kidney endothelial cells from adult rat (RKEC) indicative of an endothelial morphology. Panel B and inset shows double-label imaging of CD31 immunostaining (green) and incorporation of acetylated LDL (red). For comparison, a similar staining pattern is demonstrated in human umbilical vein endothelial cells (HUVEC, panel C). Figure 1D shows representative reverse transcriptase-PCR results for common endothelial cell markers in rat KEC and rat PMVEC. Shown are results for the VEGF receptors KDR/Flk, and Flt-1 and VEGR-accessory proteins neuropilin-1 and 2 (NRP). Note the relatively high expression of VEGF receptors in AKEC and YKEC. Also shown are results for Tie-2, Angiopoietin-1 and -2 (Ang-1, 2), and nitric oxide synthase-3 (NOS3). The control in which reverse transcriptase was omitted is indicated by “-RT”.
Figure 1
Figure 1
Characterization of the rat kidney derived endothelial cells. Figure 1A shows phase contrast image of cultured rat kidney endothelial cells from adult rat (RKEC) indicative of an endothelial morphology. Panel B and inset shows double-label imaging of CD31 immunostaining (green) and incorporation of acetylated LDL (red). For comparison, a similar staining pattern is demonstrated in human umbilical vein endothelial cells (HUVEC, panel C). Figure 1D shows representative reverse transcriptase-PCR results for common endothelial cell markers in rat KEC and rat PMVEC. Shown are results for the VEGF receptors KDR/Flk, and Flt-1 and VEGR-accessory proteins neuropilin-1 and 2 (NRP). Note the relatively high expression of VEGF receptors in AKEC and YKEC. Also shown are results for Tie-2, Angiopoietin-1 and -2 (Ang-1, 2), and nitric oxide synthase-3 (NOS3). The control in which reverse transcriptase was omitted is indicated by “-RT”.
Figure 2
Figure 2. Growth rates and colony forming potential of kidney endothelial vs pulmonary microvascular enthelial cells
A) Endothelial cells from kidneys (RKEC) from young or adult rats (AKEC, YKEC) were compared with pulmonary micrvascular (PMVEC) and pulmonary artery endothelial cells (PAEC). Cells were plated on Day 0 at a density of 50K per 24-well plate and each cell type was grown under respective optimal conditions (See Methods). Cells were counted at the indicated times. Data derived are from triplicate determinations of multiple independent cultures per group, indicated by the N. * P < 0.05 vs RPMVEC at the indicated times, by ANOVA and Student-Newman Keuls post hoc. B) Clone forming potential was determined from single cell colony forming assay. Colony sizes determined after 14 days of growth after plating at a density of 1 cell/well. Note: KEC remain as single cells or form only small colonies, C) while PMVEC form large colonies.
Figure 3
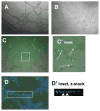
Figure 3. Kidney endothelial cells incorporate into tubular structures in vitro, but inhibit angiogenesis of pulmonary microvascular cells
Branching capacity of endothelial cell cultures was investigated and is illustrated using phase contrast microscopy following plating on Matrigel-coated plates for 6 hours for PMVEC (A) or adult KEC (B). High branching capacity of PMVEC is apparent whil e KEC have no such capacity. The effects of co-culture was determined following labeling of KEC with Cell Tracker Green and incubation with unlabeled PMVEC at a density of 1:100 (C and C′ inset). Note the incorporation of green-labeled KEC into PMVEC branches (arrows). Panel D shows KEC-derived from transgenic GFP rats were co-cultured on Matrigel with unlabeled with PMVEC. For confocal microscopy, all cells were stained with DAPI prior to imaging. As in panel C, GFP expressing KEC incorporate into PMVEC. An optical cross section based on Z-stack images were was generated VOXX software and is shown in the inset. Arrows indicate incorporation into tubular structures in the same plane as PMVECs.
Figure 4
Figure 4
Telomerase activity in kidney endothelial cells (AKEC and YKEC) and pulmonary microvascular endothelial cells (PMVEC). Cell extracts were assayed for telomerase activity assays as described in “Methods” and activity measured by gel electrophoresis of the PCR product. Telomerase activity was similar in PMVEC, AKEC and YKEC and was sharply attenuated by heating the samples (ΔH).
Figure 5
Figure 5. mRNA expression of VEGF-pathway genes in KEC vs PMVEC using PCR expression arrays
Panel A: mRNA expression data was derived using “VEGF response” pathway arrays (SA-Biosciences, See Methods) comparing expression in AKEC and RPMVEC. mRNA expression data are expressed as Log(2) normalized ratios relative to the expression in PMVEC; therefore, greater expression in AKEC vs. PMVEC corresponds to a positive value and a lower expression in AKEC is represented by negative value. Of the 84 test genes, 73 genes were detectable and the 95% CI of Log(2) ratios was set at ± 2.25. Shown are data from 19 genes with log (2) ratios > 2.25. Panel B: similar comparison was carried out on freshly isolated endothelial cells derived from the pulmonary microvasculature and kidney endothelial cells obtained prior to plating and outgrowth. Of 84 test genes, 65 were detectable. Shown are data from 8 most differentially expressed genes with an absolute value of the Log(2) ratio > 1.8. The 95% C.I. was determined to ± 2.1; and values beyond this range are indicated by *. Red arrows indicate genes expressed at higher levels in both KEC cultures (panel A) and freshly isolated KEC (panel B).
Figure 6
Figure 6
Q PCR results for Flt-1 and sFlt mRNA in PMVEC vs KEC cultured cells. Top Panel: schematic illustration demonstrating the region from which primers were designed to detect full length Flt-1 mRNA and sFlt mRNA, in which the 3′ primer targeted sequence is within intron-13 of the sFlt gene. Bottom panel: Log(2) ratio of Flt-1 and sFlt-1. The log (2) ratios were determined from 3 replicate determinations per group. * indicates log(2) ratio was outside 99% C.I. (= 3.28) determined in Figure 5A.
Figure 7
Figure 7. Effect of VEGF on the growth potential of kidney endothelial cells (KEC) and pulmonary microvascular endothelial cells
A) Growth rates for KEC from adult and young animals and PMVEC were followed for 3 days with or without supplementation of VEGF-165 (50 ng/ml). VEGF significantly enhanced the growth of PMVEC over 3 days, but did not influence the growth rate of KEC from either adult or young rats. B) Data from from panel A, rescaled to show KEC growth and impaired response to 50 ng/ml VEGF. C; VEGF dose response of KEC proliferation (10–250 ng/ml) followed for 3 consecutive days demonstrated no responsiveness at any concentration. Each experiment was carried out in triplicate samples. In Panel A,* indicates P < 0.05 in VEGF treated vs. non-treated PMVEC, by Student’s t-test.

References

    1. Freeburg PB, Abrahamson DR. Hypoxia-Inducible Factors and Kidney Vascular Development. Journal of the American Society of Nephrology. 2003;14:2723–30. - PubMed
    1. Nyengaard J, Rasch R. The impact of experimental diabetes mellitus in rats on glomerular capillary number and sizes. Diabetologia. 1993;36:189–94. - PubMed
    1. Ostendorf T, Kunter U, Eitner F, Loos A, Regele H, Kerjaschki D, Henninger DD, Janjic N, Floege VEGF165 mediates glomerular endothelial repair. The Journal of Clinical Investigation. 1999;104:913–23. - PMC - PubMed
    1. Nangaku M, Alpers CE, Pippin J, Shankland SJ, Adler S, Kurokawa K, Couser WG, Johnson RJ. A new model of renal microvascular endothelial injury. Kidney Int. 1997;52:182–94. - PubMed
    1. Iruela-Arispe L, Gordon K, Hugo C, Duijvestijn A, Claffey K, Reilly M, Couser W, Alpers C, Johnson R. Participation of glomerular endothelial cells in the capillary repair of glomerulonephritis. Am J Pathol. 1995;147:1715–27. - PMC - PubMed

Publication types

Substances