Review
. 2012 Jul 20;4(5):e00093.
doi: 10.1042/AN20120021.

Fueling and imaging brain activation

Affiliations
Review

Fueling and imaging brain activation

Gerald A Dienel. ASN Neuro. .

Erratum in

  • ASN Neuro. 2012;4(6):423

Abstract

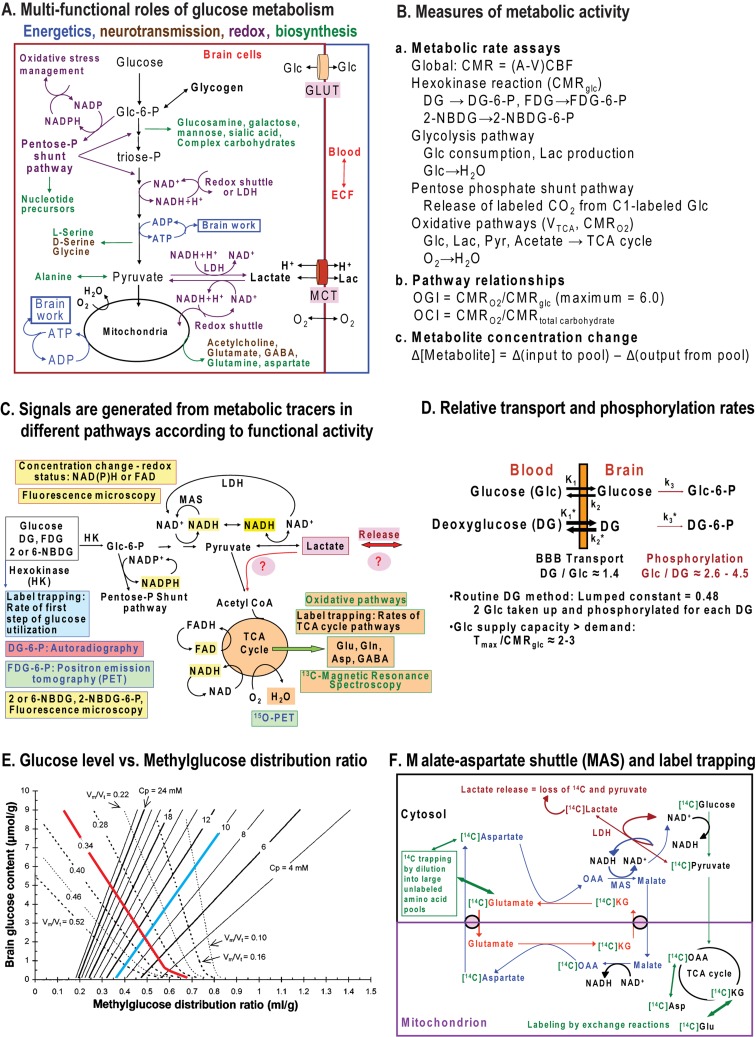
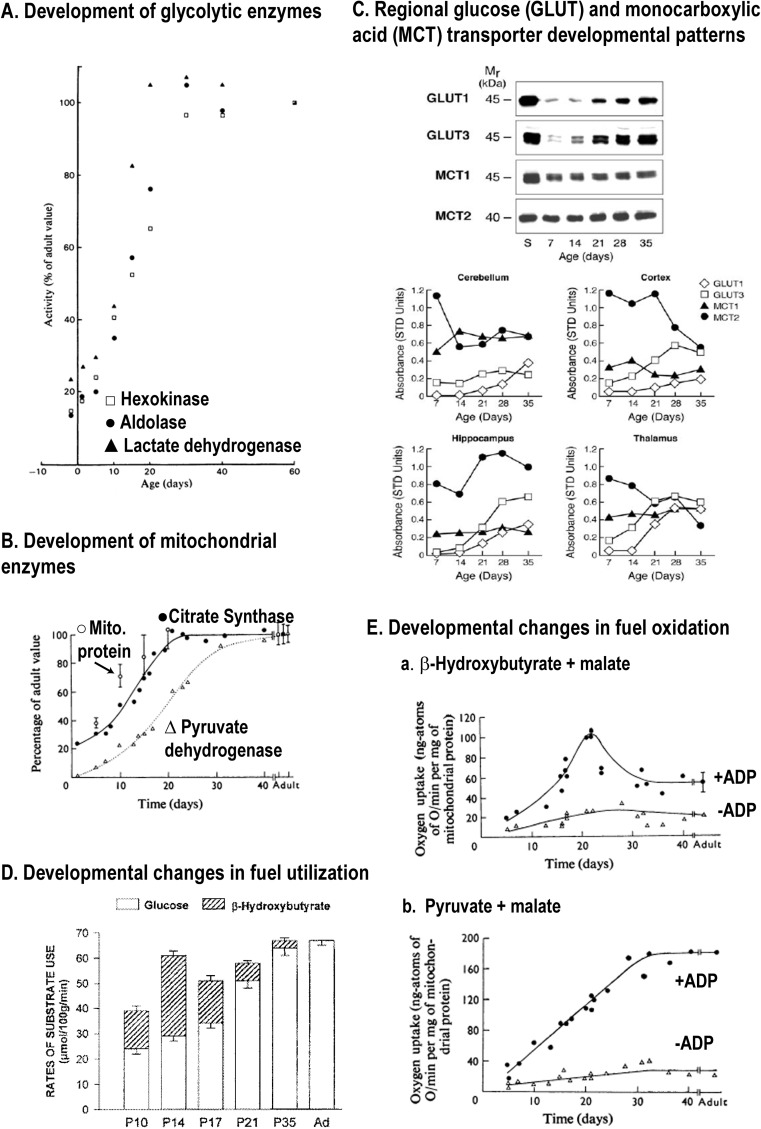
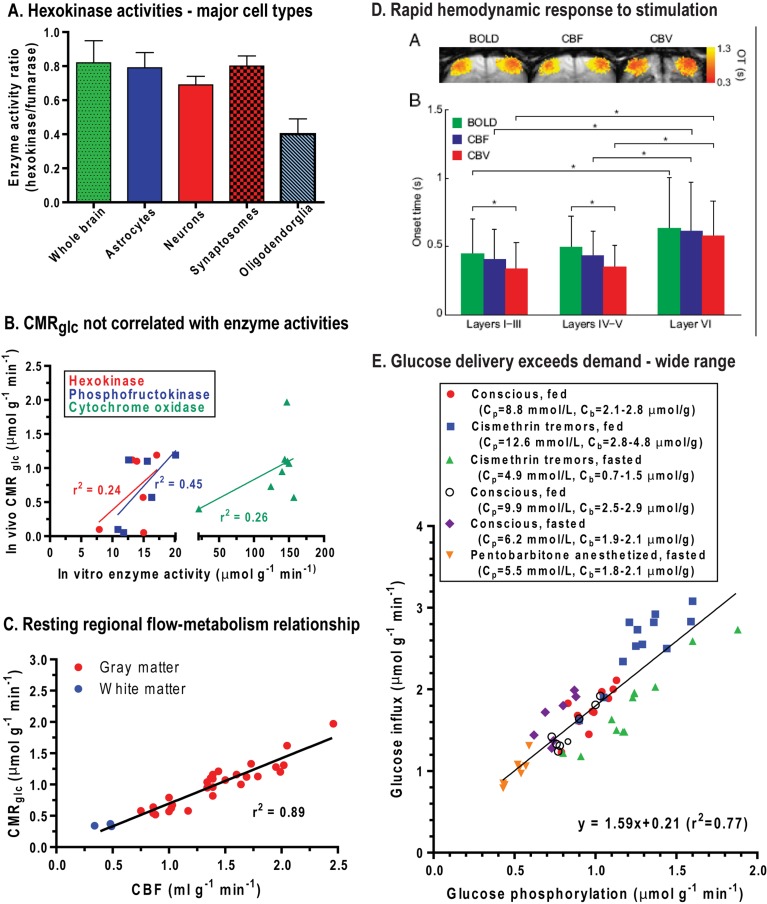
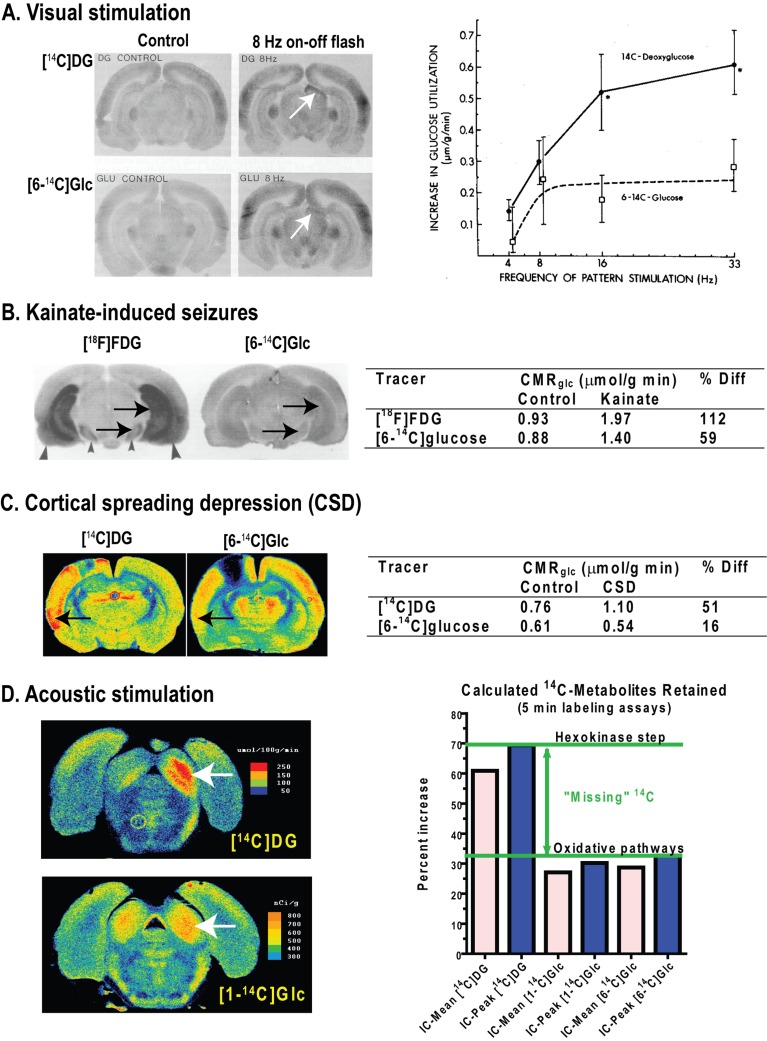
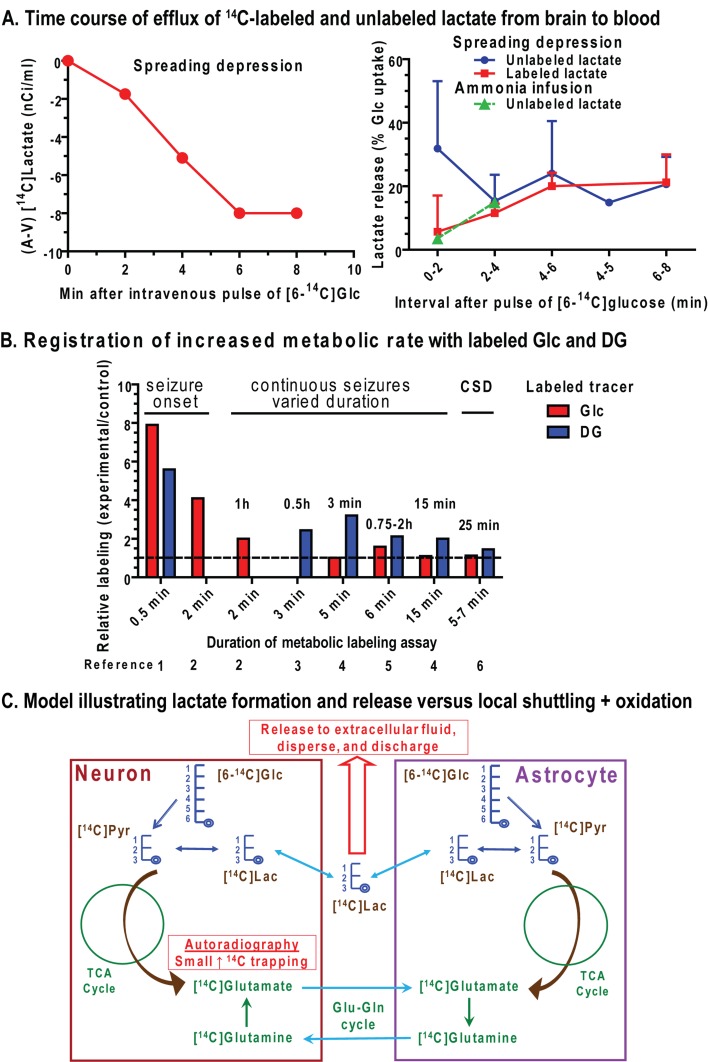
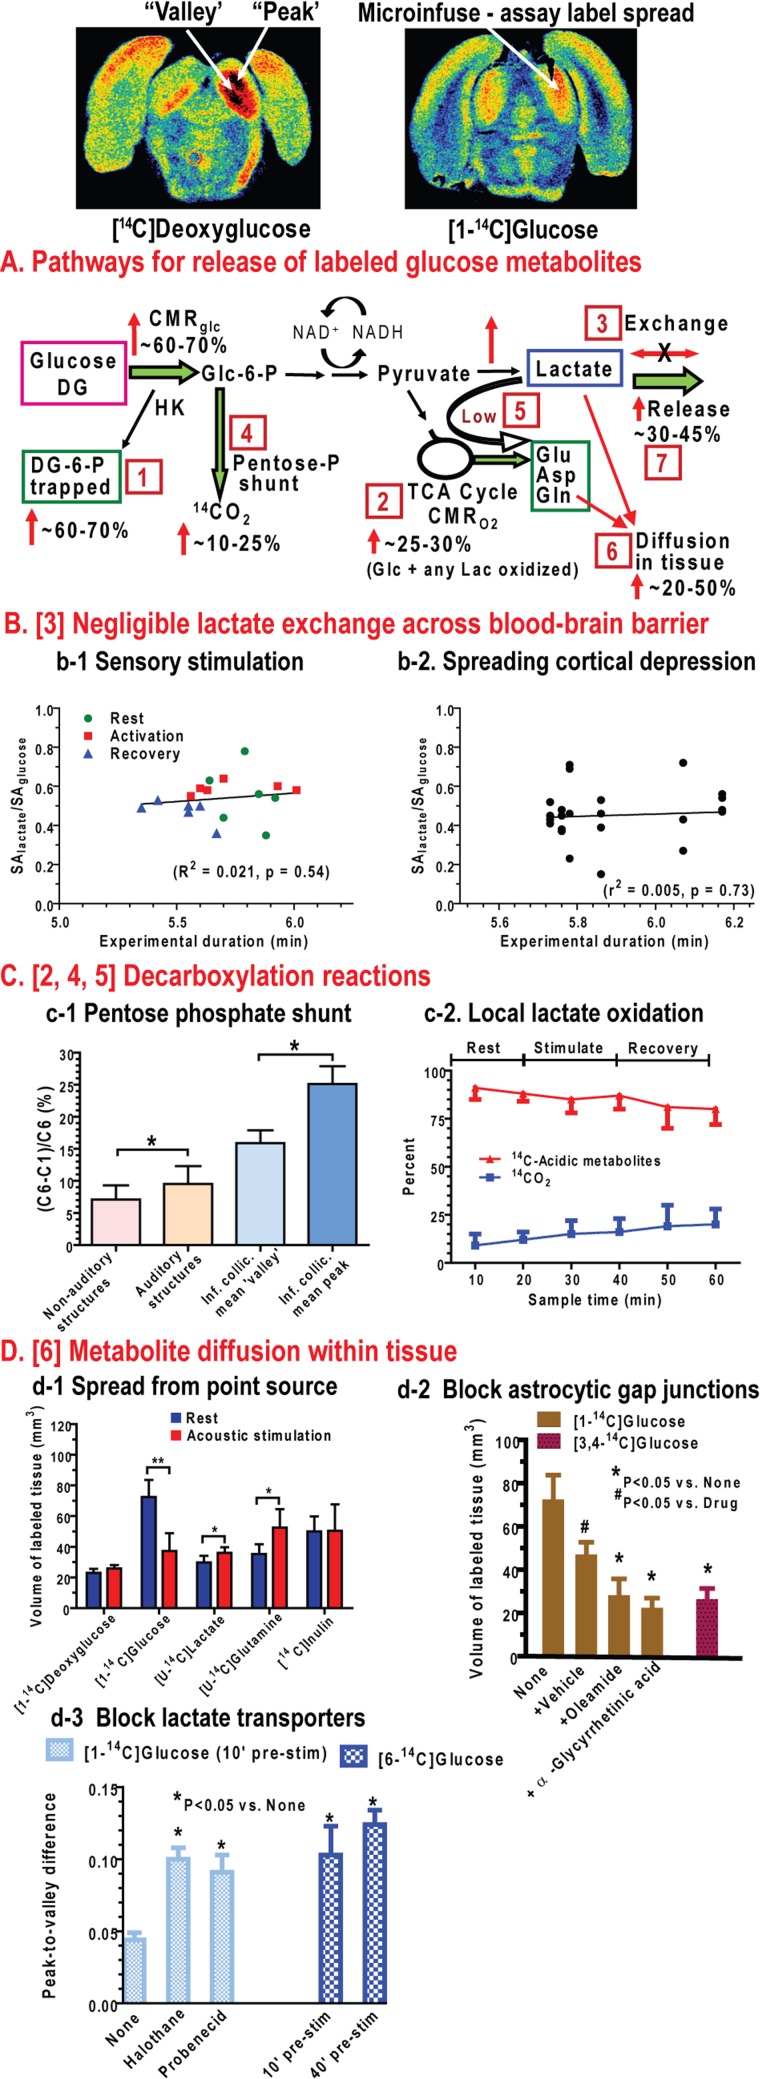
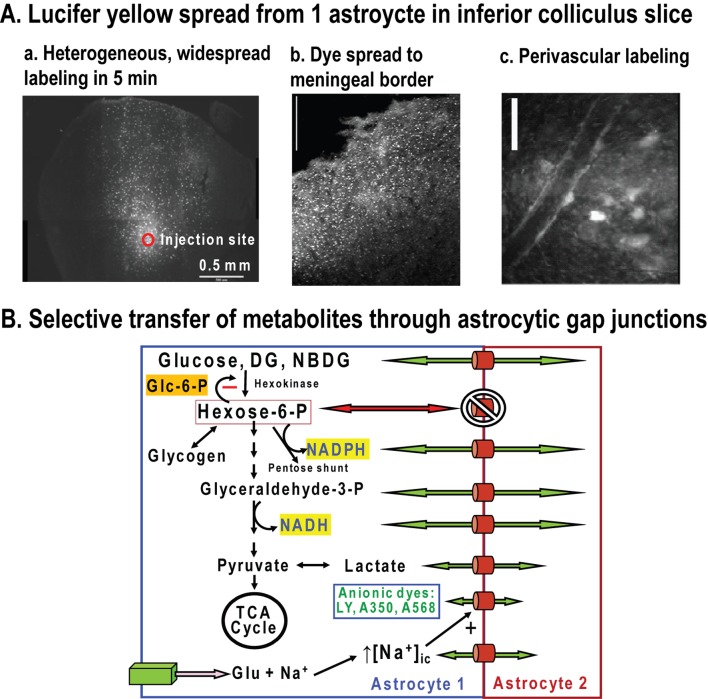
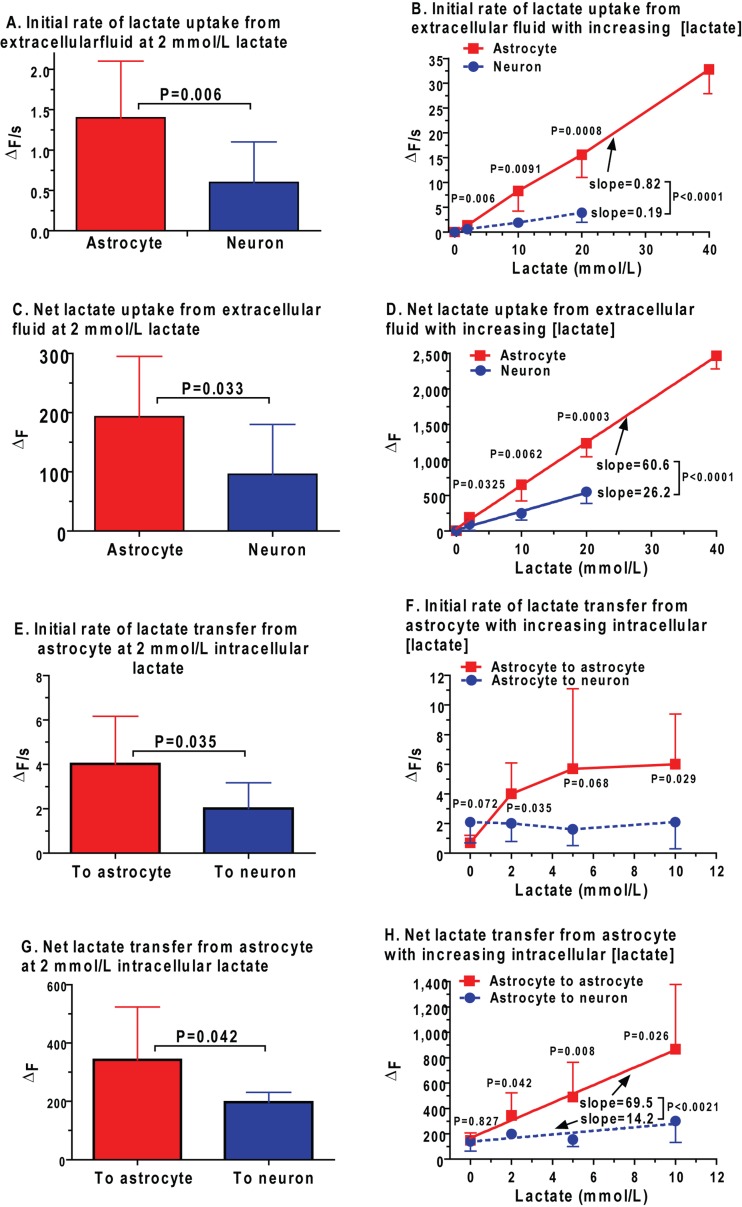
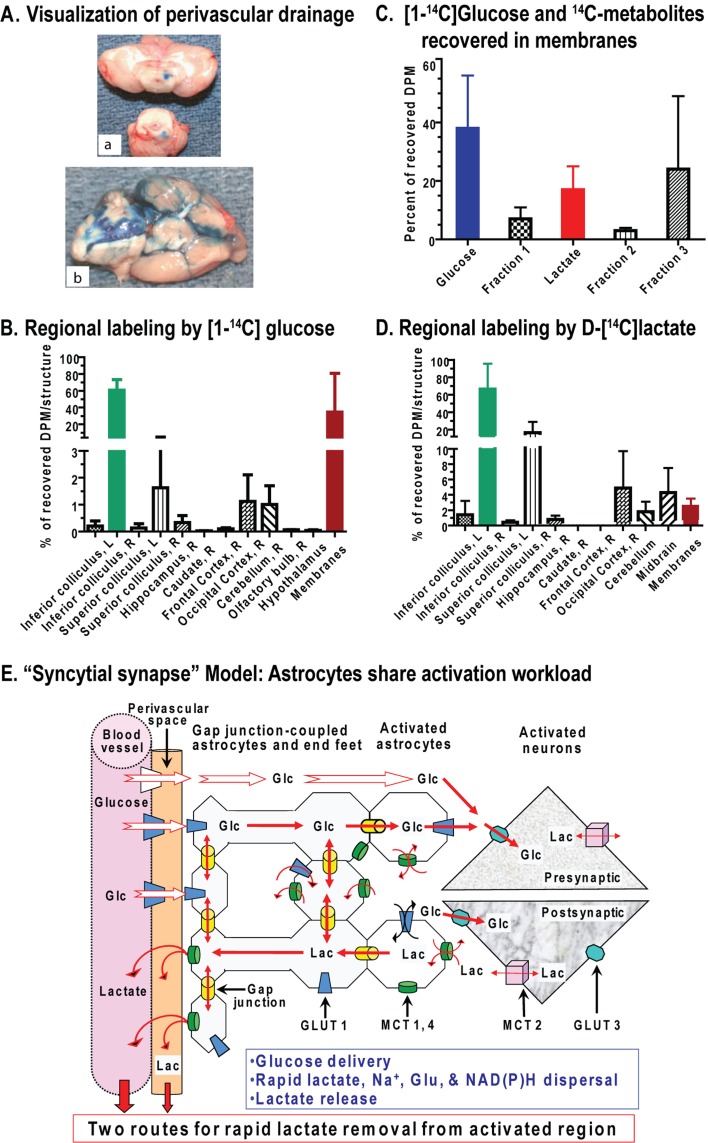
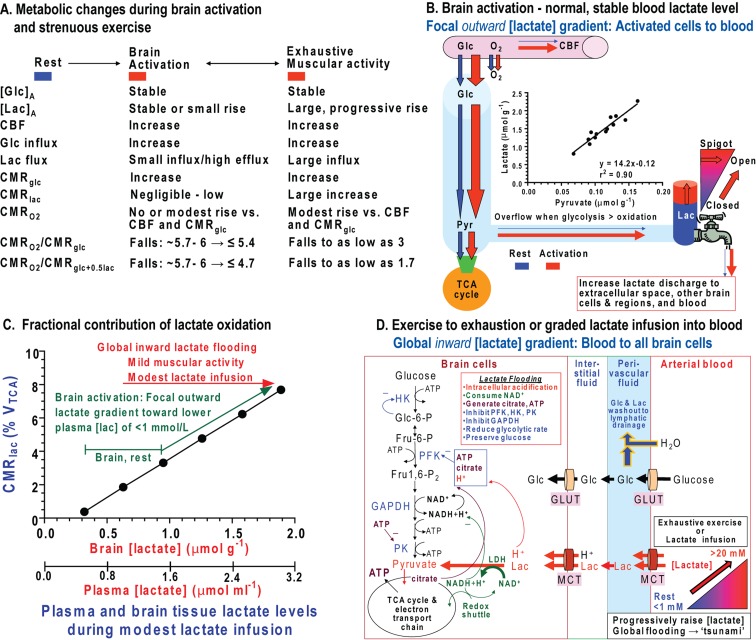
Metabolic signals are used for imaging and spectroscopic studies of brain function and disease and to elucidate the cellular basis of neuroenergetics. The major fuel for activated neurons and the models for neuron-astrocyte interactions have been controversial because discordant results are obtained in different experimental systems, some of which do not correspond to adult brain. In rats, the infrastructure to support the high energetic demands of adult brain is acquired during postnatal development and matures after weaning. The brain's capacity to supply and metabolize glucose and oxygen exceeds demand over a wide range of rates, and the hyperaemic response to functional activation is rapid. Oxidative metabolism provides most ATP, but glycolysis is frequently preferentially up-regulated during activation. Underestimation of glucose utilization rates with labelled glucose arises from increased lactate production, lactate diffusion via transporters and astrocytic gap junctions, and lactate release to blood and perivascular drainage. Increased pentose shunt pathway flux also causes label loss from C1 of glucose. Glucose analogues are used to assay cellular activities, but interpretation of results is uncertain due to insufficient characterization of transport and phosphorylation kinetics. Brain activation in subjects with low blood-lactate levels causes a brain-to-blood lactate gradient, with rapid lactate release. In contrast, lactate flooding of brain during physical activity or infusion provides an opportunistic, supplemental fuel. Available evidence indicates that lactate shuttling coupled to its local oxidation during activation is a small fraction of glucose oxidation. Developmental, experimental, and physiological context is critical for interpretation of metabolic studies in terms of theoretical models.


Figures

Figure 1
Figure 1. Major pathways for glucose metabolism and methods to assay pathway rates
(A) Colour coding identifies different aspects of the glycolytic, pentose-phosphate shunt pathway, oxidative pathway, biosynthetic routes associated with synthesis of various compounds including acetylcholine and amino acid neurotransmitters, and redox shuttling. Note that oxidizable alternative substrates (e.g., lactate, acetate, amino acids or ketone bodies) cannot satisfy many important upstream functions fulfilled by glucose metabolism. Reproduced with permission from: Dienel GA (2011) Brain lactate metabolism: the discoveries and the controversies. J Cereb Blood Flow Metab, doi:10.1038/jcbfm.2011.175. (B) Different aspects and pathways of glucose metabolism can be measured by local and global methods using glucose analogues or glucose labelled in specific carbon atoms. Oxidative pathways are assessed with many labelled precursors and by direct assay of oxygen consumption. Overall pathway relationships are assessed by comparison of oxygen and glucose or total carbohydrate utilization. Note that metabolite concentration changes reflect the difference between input and output, not flux through the pool. (C) Brain imaging and spectroscopic studies depend on signals derived from metabolic activity to calculate pathway rates and redox changes. Glucose analogues (DG, FDG and 2-NBDG) have limited metabolism, are trapped as the hexose 6-phosphate, and are used to assay the hexokinase step and calculate total glucose utilization rate. Incorporation of label from glucose into TCA cycle-derived amino acids enables calculation of oxidative rates and glutamate–glutamine cycling. Respiration is assayed by PET or MRS by assaying incorporation of labelled oxygen into water. Fluorescence of endogenous redox compounds (NADH, NADPH and FAD) are used to localize and quantify redox changes under different conditions. Lactate can be released to maintain redox balance or serve as an supplementary fuel when present in high concentrations. Reprinted from Basic Neurochemistry 8th Ed, Mary C. McKenna, Gerald A. Dienel, Ursula Sonnewald, Helle S. Waagepetersen, Arne Schousboe, Chapter 11 - Energy Metabolism of the Brain, 200–231, Copyright (2012), with permission from Elsevier. (D) Use of glucose analogues to measure glucose utilization rate requires knowledge of relative rates of transport and phosphorylation of the analogue and of glucose at various glucose concentrations. DG is transported into brain faster than glucose, whereas glucose is phosphorylated by hexokinase faster than DG and the capacity for glucose transport into brain exceeds the demand for glucose. The thickness of the arrows for transport and phosphorylation are scaled to represent relative values for the rate constants for uptake into brain from arterial plasma (K1, K1*, where the asterisk denotes the glucose analogue, that is, tracer [14C]DG), efflux from brain to blood (k2 and k2*), and phosphorylation by hexokinase (k3 and k3*). The DG/Glc transport coefficient (K1*/K1) determined in rat brain ranges from approximately 1.3 to 1.5 (Cunningham and Cremer, 1981; Pardridge et al., 1982; Crane et al., 1983; Fuglsang et al., 1986; Hargreaves et al., 1986; Holden et al., 1991). The DG/Glc phosphorylation coefficient (k3*/k3) determined in rat brain ranges from approximately 0.22 to 0.38 (Sols and Crane, 1954; Cunningham and Cremer, 1981; Pardridge et al., 1982; Crane et al., 1983; Kapoor et al., 1989; Holden et al., 1991). The ratio of maximal transport (Tmax) to maximal phosphorylation rate (Vmax) for glucose is estimated to be approximately 3:1(Buschiazzo et al., 1970; Holden et al., 1991), and the ratio of Tmax to CMRglc is estimated to be in the range of approximately 1.5–2.5 (or higher) in rat and human brain (Cremer et al., 1981; Pardridge et al., 1982; Hargreaves et al., 1986; Cremer et al., 1988; Gruetter et al., 1998; Choi et al., 2001; de Graaf et al., 2001; Shestov et al., 2011), whether using the standard or reversible Michaelis–Menten kinetic model (Cunningham et al., 1986). The lumped constant of the [14C]DG method takes these kinetic differences into account, with the net result that about two glucose molecules are phosphorylated for each DG phosphorylated (Sokoloff et al., 1977). This means that, with no correction for product loss, accumulation of metabolites of glucose should exceed DG-6-P accumulation by approximately 2-fold due to greater phosphorylation coefficient. Note that these relationships are not established for neurons, astrocytes, or oligodendrocytes or for 2-NBDG and 6-NBDG, the fluorescent glucose analogues, so differences among cell types cannot be interpreted (E) Contour map showing the steady-state brain-to-plasma distribution ratio of the non-metabolizable analogue 3-O-methylglucose and brain glucose concentration. When metabolic rate is constant and plasma glucose level held at different but fixed levels, the relationship between glucose level and methylglucose distribution ratio is illustrated by the dotted lines. The red line represents the normal resting rat brain for which Vmax/Tmax (ratio of maximal phosphorylation to maximal transport capacities) is 0.34. As plasma glucose concentration (Cp) is reduced, brain glucose level falls and the methylglucose distribution ratio rises, particularly at the lowest brain glucose levels. The continuous lines illustrate the relationships for varying demand at fixed plasma glucose level. When plasma glucose is fixed, for example, at 10 mmol/l (blue line) and metabolism is increased (i.e. Vmax/Tmax rises), brain glucose level and methylglucose distribution ratio both decrease (the blue line falls below the red line). In contrast, when metabolic rate is reduced (e.g., by anaesthesia), brain glucose level and methylglucose distribution ratio rise (blue line). Reproduced with permission from: Dienel GA, Cruz NF, Adachi K, Sokoloff L, Holden JE (1997), Determination of local brain glucose level with [14C]methylglucose: effects of glucose supply and demand, Am J Physiol., 273(5 Pt 1):E839–49. The lumped constant for DG is relatively stable during normoglycaemia and hypoglycaemia, but rises when brain glucose level falls (Dienel et al., 1991; Holden et al., 1991); methylglucose distribution ratio can be used to determine brain glucose level and the appropriate value for the lumped constant (Dienel et al., 1997). Thus, supply and demand govern the relationship between glucose and non-metabolizable and metabolizable glucose analogues. Measured and theoretical values are in good agreement for deoxyglucose and methylglucose. Similar relationships are anticipated for the relationships between intracellular and extracellular glucose levels and metabolic demand. These relationships must also be established for the non-metabolizable fluorescent tracer 6-NBDG. The ‘lumped constant’ must be determined for 2-NBDG. (F) Pyruvate production and flux through the glycolytic pathway requires regeneration of NAD+ from NADH by means of the MAS. This pathway also shuttles TCA cycle intermediates and amino acids across the mitochondrial membrane, and is essential for trafficking of labelled intermediates from mitochondria to the larger unlabelled cytoplasmic amino acid pools. Lactate production removes pyruvate as an oxidative substrate for that cell and reduces label mixing by replacing the MAS to regenerate NAD+. Lactate oxidation requires the MAS activity (see A). Reprinted from Neurochem Int. 45(2-3), Dienel GA, Cruz NF, Nutrition during brain activation: does cell-to-cell lactate shuttling contribute significantly to sweet and sour food for thought? 321–513, Copyright (2004), with permission from Elsevier.
Figure 2
Figure 2. Postnatal development of enzymatic and transporter capacities and fuel utilization in rat brain
Brain maturation involves an enormous increase in metabolic capacity along with selective changes in specific enzymes, transporters and fuel utilization during postnatal development that vary temporally with brain region and mammalian species (Baquer et al., 1975; Cremer et al., 1975; Cremer, 1982; Nehlig et al., 1988; Clark et al., 1993; Nehlig and Pereira de Vasconcelos, 1993). Representative patterns in different pathways are illustrated. (A) Comparative development of three glycolytic enzymes in rat cerebral cortex, expressed as a percentage of respective values in the 50-day-old adult. Glycolytic capacity increases approximately 5-fold from birth to adult, with large changes after 20 days (approximate age of weaning). Leong SF, Clark JB. (1984), Regional enzyme development in rat brain. Enzymes of energy metabolism, Biochem J;218(1):139–45 copyright the Biochemical Society. (B) TCA cycle enzymes show different developmental patterns, with the postnatal rise in PDH lagging that of citrate synthase and mitochondrial protein. Note that PDH activity is a negligible percent of adult value at birth, and by day 20 it is only 60% of the adult value. Land JM, Booth RF, Berger R, Clark JB (1977), Development of mitochondrial energy metabolism in rat brain., Biochem J 164:339–348 copyright the Biochemical Society. (C) Nutrient transporters in the vascular-free membranes of different brain regions have different developmental profiles. Western blots are shown for hippocampus (top) and patterns in four brain regions are shown graphically (bottom). The patterns for the glucose transporter in astrocytes (GLUT1) and neurons (GLUT3) rise in parallel, with larger increments for GLUT3. The MCTs in astrocytes (MCT1) and neurons (MCT2) also show distinct regional patterns, particularly the decrease in MCT2 level in cerebral cortex after the age of 21 days. Figure previously published in Am J Physiol Endocrinol Metab, Vannucci and Simpson, 285, 2003, and pp. 339–348 ©The American Physiological Society (APS). (D) Ketone bodies, for example, β-hydroxybutyrate, are a significant brain fuel during the postnatal (P) suckling period, and they continue to be used along with glucose until the age of 35 days in the rat, after which glucose is the major fuel. Glucose and total fuel utilization rise during postnatal development, but the proportions vary with age. After weaning the MCT at the blood–brain barrier is reduced markedly, diminishing ketone body and lactate transport capacity by approximately 10-fold in adult (Ad) compared with immature rats (Cremer et al., 1979). This figure was published in: Nehlig A. Cerebral energy metabolism, glucose transport and blood flow: changes with maturation and adaptation to hypoglycaemia. Diabetes Metab. 1997;23(1):18-29. Copyright © 1997 Elsevier Masson SAS. All rights reserved. (E) (a) Maximal respiration rate with β-hydroxybutyrate as fuel is attained at approximately 20 days and requires the presence of ADP as co-substrate for ATP synthesis. Note that ketone body utilization falls (see D) before attaining maximal capacity, which is lower in adult rat brain. (b) Pyruvate-supported respiration progressively rises with age, paralleling the rise in PDH activity (see B). At 20 days the rate is approximately 70% that of the adult value. Land JM, Booth RF, Berger R, Clark JB (1977), Development of mitochondrial energy metabolism in rat brain., Biochem J 164:339–348 copyright the Biochemical Society.
Figure 3
Figure 3. Enzyme activities, glucose utilization rate and fuel supply-demand relationships in adult rat brain
(A) Hexokinase activities relative to those of fumarase in whole rat brain homogenate and in isolated synaptosomes and major cell types. Data from Snyder and Wilson (1983). (B) Local glucose utilization rates (CMRglc) tend to be higher in brain structures with higher enzyme amounts (i.e. maximal in vitro activity assayed under optimal conditions), but the correlations are poor. CMRglc values are from Sokoloff et al. (1977), hexokinase and phosphofructokinase activities from Leong et al. (1981) and cytochrome oxidase activities from Hevner et al. (1995). Each point represents a different brain structure. (C) Local rates of glucose utilization are linearly related to local rates of CBF in conscious resting rat brain. Each point represents a different brain structure. Plotted from data of Sokoloff et al. (1977) and Sakurada et al. (1978) and reproduced from This figure was published in: From Molecules to Networks. An Introduction to Cellular and Molecular Neuroscience, 2 Edition, Byrne JH, Roberts JL (eds), Dienel GA, Energy Metabolism in the Brain, pp 49-110, Copyright Elsevier (2009). (D) Mean OT (onset time) for the BOLD, CBF and CBV (cerebral blood volume) changes in layers of cerebral cortex after bilateral electrical stimulus to both forelimbs of α-chloralose-anaesthetized rats. OTs varied but were very fast, between 340 and 610 ms. Re-printed with permission from: Hirano Y, Stefanovic B, Silva AC, (2011), Spatiotemporal evolution of the functional magnetic resonance imaging response to ultrashort stimuli, J Neurosci, 31:1440-1447. (E) Unidirectional glucose influx and glucose phosphorylation were assayed simultaneously in different regions of rat brain of conscious or anaesthetized, fed or fasted rats with or without cismethrin-induced tremors (plotted from data of Cremer et al., 1983; Hargreaves et al., 1986). Glucose delivery was approximately 160% that of CMRglc over a wide range of arterial plasma (Cp) and brain (Cb) glucose concentrations and CMRglc.
Figure 4
Figure 4. Underestimation of metabolic activation in autoradiographic assays of glucose utilization with [1- or 6-14C]glucose compared with [14C]deoxyglucose
(A) Rats were given unilateral visual stimulation with on-off flash to activate metabolic activity in the dorsal superior colliculus of conscious rats (white arrows). Autoradiographs illustrate images obtained from [14C]DG and [6-14C]glucose ([6-14C]Glc) at 8 Hz, and the graph shows the incremental increase in calculated glucose utilization above no stimulation as function of stimulus frequency. Figure reprinted from Collins RC, McCandless DW, Wagman IL (1987) Cerebral glucose utilization: comparison of [14C]deoxyglucose and [6-14C]glucose quantitative autoradiography. J Neurochem 49:1564–1570. published by John Wiley and Sons © International Society for Neurochemistry. (B) Seizures were induced in conscious rats by kainic acid prior to CMRglc assays with [18F]FDG and [6-14C]glucose in the same rat. Glucose utilization increased in several brain structures (hippocampus, upper horizontal arrows; entorhinal cortex, large arrowheads; substantia nigra, small arrowheads and lower horizontal arrows). Registration of label accumulation by [18F]FDG was much higher than for [6-14C]glucose; the Table shows calculated CMRglc and percentage difference (Diff) for the hippocampus. Reprinted by permission from Macmillan Publishers Ltd: [J Cereb Blood Flow Metab] (Ackermann and Lear (1989), Glycolysis-induced discordance between glucose metabolic rates measured with radiolabeled fluorodeoxyglucose and glucose, J Cereb Blood Flow Metab 9:774-785), copyright (1989). (C) Unilateral topical application of KCl to the dorsal left hemisphere of conscious rats increases glucose utilization; metabolic activation is higher in the [14C]DG compared with [6-14C]glucose autoradiographs. Colour scales indicate metabolite rate for [14C]DG and 14C concentration for [14C]glucose. The scale from low to high CMRglc or 14C concentration is blue, green, yellow and red. Quantitative values are shown in the Table. Data are from (Adachi et al., 1995; Cruz et al., 1999). (D) Unilateral (right) acoustic stimulation with an 8 kHz tone increases glucose utilization in groups of cells that preferentially respond to the tone. Tonotopic bands in the inferior colliculus are readily detected with [14C]DG compared with [1- or 6-14C]glucose (horizontal arrows), and right-left differences are also greater with [14C]DG. Colour scales indicate metabolic rate for [14C]DG and 14C concentration for [14C]glucose. The graph shows the percentage increase in labelling in 5 min metabolic assays. IC-mean denotes the mean percentage increase for the entire inferior colliculus, and the IC-peak value is for the major tonotopic band (arrow). Corresponding percentage increases were also determined with [1- or 6-14C]glucose. Since DG assays total glucose utilization at the hexokinase step and glucose registers mainly the oxidative pathways (see Figure 1), the missing label represents loss of diffusible labelled metabolites of glucose. Figure reprinted from Nancy F. Cruz, Kelly K. Ball, Gerald A. Dienel (2007) Functional imaging of focal brain activation in conscious rats: Impact of [14C]glucose metabolite spreading and release, J Neurosci Res 85:3254-3266 published by John Wiley and Sons Copyright © 2007 Wiley-Liss, Inc.
Figure 5
Figure 5. Lactate efflux from brain and dependence of underestimation of metabolic activation with [14C]glucose on duration of labelling assay
(A) Left panel: time course of release of [14C]lactate from brain at intervals after pulse labelling with [6-14C]glucose during bilateral cortical spreading depression. Each point represents the a–v difference during a 2-min sampling interval plotted at the time of the end of the interval. Lactate was the predominant labelled compound released to blood; release of 14C-labelled amino acids and 14CO2 into venous blood was very low and slow (not shown). Reprinted by permission from Macmillan Publishers Ltd: (J Cereb Blood Flow Metab] (Cruz NF, Adachi K, Dienel GA (1999), Rapid efflux of lactate from cerebral cortex during K+ -induced spreading cortical depression., J Cereb Blood Flow Metab 19:380-392), copyright (1999). Right panel: time courses of release of labelled and unlabelled lactate from brain at intervals after pulse labelling during spreading cortical depression [reprinted by permission from Macmillan Publishers Ltd: (J Cereb Blood Flow Metab) (Cruz NF, Adachi K, Dienel GA (1999), Rapid efflux of lactate from cerebral cortex during K+ -induced spreading cortical depression., J Cereb Blood Flow Metab 19:380-392), copyright (1999)] or after an acute intravenous ammonia injection where the values plotted at 2–4 min are actually at 4–5 min (data from Hawkins et al., (1973). Values are expressed as percentage of glucose entering the brain in the same a–v sample pair. (B) Labelled glucose registers large increases in metabolic activation with very short (0.2–2 min), but not longer (5–15 min) assay intervals. Data are expressed relative to the control value in each study. Duration of seizures or CSD (cortical spreading depression) is indicated above the respective data sets. Data are from the following references: (1) (Miller et al., 1982); (2) (Borgstrom et al., 1976); (3) (Cremer et al., 1988); (4) (Van den Berg and Bruntink, 1983); (5) (Ackermann and Lear, 1989); (6) (Adachi et al., 1995). (C) Glucose is metabolized in neurons and astrocytes, and autoradiographic studies indicate that a large fraction of the label derived from glucose is not retained in the cell (Figure 4). If lactate were produced by either neurons or astrocytes and shuttled to another cell where it is oxidized, the label should be diluted into the large amino acid pools due to the action of the MAS (Figure 1) and trapped in the activated tissue. Lack of trapping indicates rapid release of labelled metabolites, mainly lactate. Reprinted from Neurochem Int, 45, Dienel GA and Cruz NF, Nutrition during brain activation: does cell-to-cell lactate shuttling contribute significantly to sweet and sour food for thought? 321–351, Copyright (2004), with permission from Elsevier.
Figure 6
Figure 6. Assessment of pathways and routes for release of label from activated tissue
For reference, autoradiographs from conscious rats given unilateral single-tone acoustic stimulation show the patterns of metabolic labelling with 14C-labelled DG and glucose (From Cruz et al., 2007; see Figure 4D). The tonotopic bands with the highest rates of glucose utilization in the [14C]DG autoradiograph (black) are denoted as ‘peaks’ and the region between the two peaks as ‘valley’ (see Figure 6D, d-3). In some studies labelled tracers were microinfused into the inferior colliculus of the conscious rat to evaluate lactate oxidation (Figure 6C, c-2) or label spreading (Figure 6D). (A) Diagram illustrating major sites for trapping or release of metabolic tracers. The numbers in boxes represent pathways that are assessed in (BD) and identified in brackets in the titles. The difference in trapping of metabolites of DG (A, pathway 1) and retention of labelled metabolites of glucose (A, pathway 2) reflects loss of label from activated tissue (A, pathway 7). (B) Ratio of specific activity of brain lactate to that of brain glucose as function of experimental duration before, during, and after generalized sensory stimulation (b-1) and during spreading depression (b-1). The mean relative specific activity (SA) of lactate is half that of [6-14C]glucose, that is, equal the theoretical maximum, because [6-14C]glucose produces one labelled and one unlabelled lactate, reducing the specific activity in half. These data rule out exchange (A, pathway 3) as a major factor in label loss, because release of labelled lactate and uptake of unlabelled lactate would reduce lactate specific activity. Figure reprinted from Dienel and Cruz, 2009 Exchange-mediated dilution of brain lactate specific activity: implications for the origin of glutamate dilution and the contributions of glutamine dilution and other pathways. J Neurochem 109 Suppl 1:30-37 published by John Wiley and Sons © 2009 The Authors. Journal Compilation © 2009 International Society for Neurochemistry. (C, c-1) C1 of glucose is lost by decarboxylation via the pentose-phosphate shunt pathway. Pentose shunt pathway flux was calculated from data in the study of (Cruz et al., 2007) from differential labelling of the total metabolite pool by [1- and 6-14C]glucose, expressed as a percentage: 100*([6-14C]glucose–[1-14C]glucose)/[6-14C]glucose. These values mainly represent the percentage of oxidative metabolism of glucose, which would be higher than the percentage of total glucose utilization. These results demonstrate that loss of label from C1 of glucose increases to approximately 25% of the level of glucose oxidation during acoustic activation (A, pathway 4). (c-2) Local oxidation of lactate generated from [3,4-14C]glucose microinfused into the inferior colliculus of conscious rats. 14C from C3,4-labelled glucose is released at the PDH step, and if lactate is formed and rapidly, locally oxidized the level of 14CO2 in extracellular fluid should be similar to that of [14C]lactate. However, lactate accounted for approximately 80% of the 14C in extracellular fluid, ruling out high rates of local oxidation of lactate generated from glucose in brain (A, pathway 5). Reprinted with permission from Kelly K Ball, Nancy F Cruz, Robert E Mrak and Gerald A Dienel (2010), Trafficking of glucose, lactate, and amyloid-beta from the inferior colliculus through perivascular routes, J Cereb Blood Flow Metab 30:162-176. (D, d-1) Different tracers were microinfused into the inferior colliculus of conscious rats during rest and acoustic stimulation, and the volume of labelled tissue measured. The volume labelled by DG did not change during activation. The higher volume labelled by glucose compared with DG during rest indicates that metabolites downstream of Glc-6-P diffused from the site of phosphorylation, and the fall in labelled volume during activation indicates product loss or restricted movement of metabolites. Spreading of lactate and glutamine increased during acoustic stimulation, whereas that of the extracellular marker, inulin, did not. (d-2) Microinfusion of two gap junction inhibitors into the unstimulated inferior colliculus before [14C]glucose significantly reduced label spread, consistent with metabolite diffusion through astrocytic gap junctions. If label spread were mainly due to lactate, the volume of labelled tissue should be high for [3, 4-14C]glucose because label would be retained in lactate; the low volume suggests diffusion of TCA cycle-derived compounds (e.g., glutamate, glutamine). (d-3) The peak-to-valley ratio is a measure of focal activation. The higher the ratio, the greater the rise in local CMRglc in the peak compared with an adjacent region, the valley. The ratio doubled when assayed in halothane-anaesthetized rats (halothane can block gap junctions) and with probenecid treatment to block lactate transport. Changing the position of the label to C6 of glucose also doubled the ratio, which was the same at the beginning or end of the routine DG assay (indicating no change in metabolic response during the 45 min interval). Plotted from data of Cruz et al. (2007). Together, these findings demonstrate that spreading of metabolites within activated tissue is mediated, in part, by lactate transporters and astrocytic gap junctions, and it contributes to loss of registration of focal activation when [14C]glucose is the tracer (A, pathway 6).
Figure 7
Figure 7. Gap junctional communication among astrocytes in the inferior colliculus
(A) Astrocytes in the adult rat inferior colliculus are highly coupled by gap junctions. Diffusion of Lucifer Yellow VS into a single astrocyte for 5 min labels up to approximately 10 000 cells (left panel), with high labelling of soma at the dorsal border of the inferior colliculus (middle panel, scale bar, 100 μm) and their perivascular endfeet (scale bar = 25 μm). Figure re-printed from Gautam K. Gandhi, Nancy F. Cruz, Kelly K. Ball, Gerald A. Dienel (2009) Astrocytes are poised for lactate trafficking and release from activated brain and for supply of glucose to neurons, Journal of Neurochemistry 111:522–536. published by John Wiley and Sons © 2009 The Authors. Journal Compilation © 2009 International Society for Neurochemistry. (B) Model illustrating highly restricted passage of three hexose-6-Ps, Glc-6-P, DG-6-P and NBDG-6-P, through astrocytic gap junctions compared with the parent sugars and to downstream metabolites, redox compounds and anionic fluorescent dyes. Schematic based on data of Gandhi et al. (2009b). Exposure of astrocytes to extracellular glutamate and K+ increases gap junctional coupling (Enkvist and McCarthy, 1994; De Pina-Benabou et al., 2001). Retention of Glc-6-P in the cell where it is phosphorylated may be necessary to ensure feedback regulation of glucose utilization in each astrocyte. Since glyceraldehyde-3-P, NADH and NADPH are all gap junction permeant, the presence of a phosphate moiety is not the sole basis for retention of hexose-6-P. Abbreviations: Glc, glucose; Glu, glutamate; ic, intracellular; P, phosphate; LY, Lucifer Yellow.
Figure 8
Figure 8. Astrocytes have high capacity for rapid lactate uptake and lactate dispersal to other gap junction-coupled astrocytes compared with neuronal lactate uptake and astrocyte-to-neuron lactate shuttling
Initial (A, B) and net (C, D) rates of lactate uptake from an extracellular point source into astrocytes and neurons at different lactate concentrations. Initial (E, F) and net (G, H) rates of lactate transfer from an astrocyte to another astrocyte or to a neuron located the same distance from the donor astrocyte as the gap junction-coupled recipient astrocyte. Figure re-printed from Gautam K. Gandhi, Nancy F. Cruz, Kelly K. Ball, Gerald A. Dienel (2009) Astrocytes are poised for lactate trafficking and release from activated brain and for supply of glucose to neurons, Journal of Neurochemistry 111:522–536. published by John Wiley and Sons © 2009 The Authors. Journal Compilation © 2009 International Society for Neurochemistry. When the extracellular lactate level approximates the mean tissue lactate level during brain activation (2 mmol/l), lactate uptake into astrocytes and lactate shuttling among astrocytes is about twice that of neurons, and the difference is larger as the lactate level rises. Astrocyte-to-neuron lactate shuttling does not change with increasing lactate level, even as high as 10 mmol/l in the donor astrocyte. Shuttling of lactate to neurons is much less than that dispersed to another astrocyte, and thousands of astrocytes are gap junction coupled.
Figure 9
Figure 9. Labelling of perivascular drainage systems by tracer microinfusion, and a model for roles of astrocytes in metabolite trafficking during brain activation
(A) Microinfusion of Evans Blue albumin into the inferior colliculus of conscious rats (a) labels the perivascular space in the meningial membranes (b). (B) Microinfusion of [1-14C]glucose into the inferior colliculus of conscious rats predominantly labels the infused inferior colliculus and meningial membranes (about 60 and 35% of recovered 14C respectively), with low-level spreading of label throughout the brain. (C) Extraction of the membranes and separation of labelled compounds revealed the presence of glucose, lactate and other unidentified compounds in three other fractions. (D) Microinfusion of non-metabolizable D-[14C]lactate also labelled many brain structures plus the meningial membranes. Data from Ball et al. (2010). (E) A model emphasizing diffusion and transporter-mediated pathways for (i) uptake of glucose from blood into brain and distribution within tissue and (ii) clearance of lactate from glycolytic domains via intracellular and extracellular routes during brain activation of relatively sedentary subjects with low blood-lactate levels. Figure re-printed from Gautam K. Gandhi, Nancy F. Cruz, Kelly K. Ball, Gerald A. Dienel (2009) Astrocytes are poised for lactate trafficking and release from activated brain and for supply of glucose to neurons, Journal of Neurochemistry 111:522-536. published by John Wiley and Sons © 2009 The Authors. Journal Compilation © 2009 International Society for Neurochemistry. The model reflects experimental findings in Figures 4–9, and emphasizes potential roles of the astrocytic syncytium to supply nutrients and disperse compounds associated with excitatory neurotransmission. Gap junctional communication can reduce the workload on individual astrocytes or their processes and form a large network to share membrane-impermeant compounds. Gap junction-coupled endfeet can direct lactate along the vasculature for discharge into perivascular fluid, where it can modulate vascular diameter. Lactate can be cleared by perivascular-lymphatic drainage systems and by release to venous blood. Abbreviations: Glc, glucose; Lac, lactate; Glu, glutamate.
Figure 10
Figure 10. Lactate gradients influence direction of lactate diffusion
(A) Typical metabolic changes reported during brain activation in normal, conscious, relatively sedentary subjects and during exhaustive exercise. Data compiled from reviews (Dienel and Cruz, 2004, 2008; Quistorff et al., 2008). (B) Lactate ‘overflow’ model illustrates an outward lactate concentration gradient from brain to blood from activated brain structures. The disproportionate rise in glycolysis compared with oxidative metabolism during brain activation increases intracellular pyruvate level, causing lactate levels to rise proportionately in accordance with the equilibrium of the LDH reaction (Siesjo, 1978). The inset shows measured pairs of lactate and pyruvate levels in brain of control animals; data are from (Folbergrova et al., 1972; Ponten et al., 1973; Ljunggren et al., 1974; Veech and Hawkins, 1974; Duffy et al., 1975; MacMillan, 1975; Miller et al., 1975; Veech, 1980). These plotted values span the range of lactate in normal and activated brain that is, approximately 0.5–2 μmol/g; the mean pyruvate and lactate concentrations were 0.11 and 1.48 μmol/g respectively, and the mean lactate/pyruvate ratio was 13.1. Intracellular lactate exceeds the extracellular level, and lactate diffuses down its concentration gradient to extracellular fluid from which it can be cleared by various routes (see Figure 9). (C) Lactate infusions. Infusion of lactate into normal conscious subjects increases the lactate concentration in arterial plasma above that measured in brain, causing lactate to diffuse into the entire brain and dissipate lactate gradients within brain. Boumezbeur et al. (2010) infused [13C]lactate into human subjects and measured its oxidation rate. The linear regressions from their Figure 6 were used to calculate human brain lactate levels from arterial plasma lactate levels at 0.5 mmol/l intervals using their equation [lactate]brain = 0.63 [lactate]plasma. These data were plotted against the corresponding calculated values for CMRlactate, calculated with their equation, CMRlac = 0.019[lac]plasma–0.007. CMRlac is expressed as % VTCA, where VTCA = 0.65 mmol/g min and represents the total oxidation rate in neurons plus glia (Boumezbeur et al., 2010). The plotted points illustrate the approximate fractional rates of lactate oxidation at plasma and brain lactate levels arising from the infusion schedule. Actual values measured by Boumezbeur et al. would be distributed around this regression line. Note that lactate contributes approximately 2–8% to total oxidation, and glucose the remaining 92–98%. For reference, the green text indicates the range of brain lactate levels in normal activated brain in subjects with lower arterial plasma lactate levels and an outward, brain-to-blood lactate gradient. The red text denotes the point above which arterial plasma levels rise during progressively increasing intensity of exercise or of higher lactate infusion schedules causing an inward, blood-to-brain lactate gradient. (D) Lactate flooding model illustrates effects of a large, global inward lactate gradient from blood to brain during extreme physical activity or infusion of large amounts of lactate. Plasma lactate levels rise above approximately 4–5 mmol/l, that is, approximately 2–4 times higher than those observed during normal brain activation of relatively sedentary subjects, and lactate floods into the entire brain. Under the most extreme condition of exercise to exhaustion, blood lactate rises to 15–20 mmol/l, and lactate influx resembles a ‘tsunami’ flood that would eliminate all local lactate gradients arising from glycolytic metabolism. Some of the lactate and glucose leaving blood might be washed out via perivascular-lymphatic drainage (see Figure 9), causing a–v differences to be overestimated. Entry of lactate into brain cells can decrease availability of NAD+ for glycolysis and cause acidification and generate ATP and citrate. Together, these regulators can inhibit phosphofructokinase activity, reduce glucose utilization and spare glucose (see text for more details).

References

    1. Abe T, Takahashi S, Suzuki N. Oxidative metabolism in cultured rat astroglia: effects of reducing the glucose concentration in the culture medium and of D-aspartate or potassium stimulation. J Cereb Blood Flow Metab. 2006;26:153–160. - PubMed
    1. Ackermann RF, Lear JL. Glycolysis-induced discordance between glucose metabolic rates measured with radiolabeled fluorodeoxyglucose and glucose. J Cereb Blood Flow Metab. 1989;9:774–785. - PubMed
    1. Adachi K, Cruz NF, Sokoloff L, Dienel GA. Labeling of metabolic pools by [6–14C]glucose during K(+)-induced stimulation of glucose utilization in rat brain. J Cereb Blood Flow Metab. 1995;15:97–110. - PubMed
    1. Araque A, Parpura V, Sanzgiri RP, Haydon PG. Tripartite synapses: glia, the unacknowledged partner. Trends Neurosci. 1999;22:208–215. - PubMed
    1. Attwell D, Laughlin SB. An energy budget for signaling in the grey matter of the brain. J Cereb Blood Flow Metab. 2001;21:1133–1145. - PubMed

Publication types

LinkOut - more resources